
Figure 14:
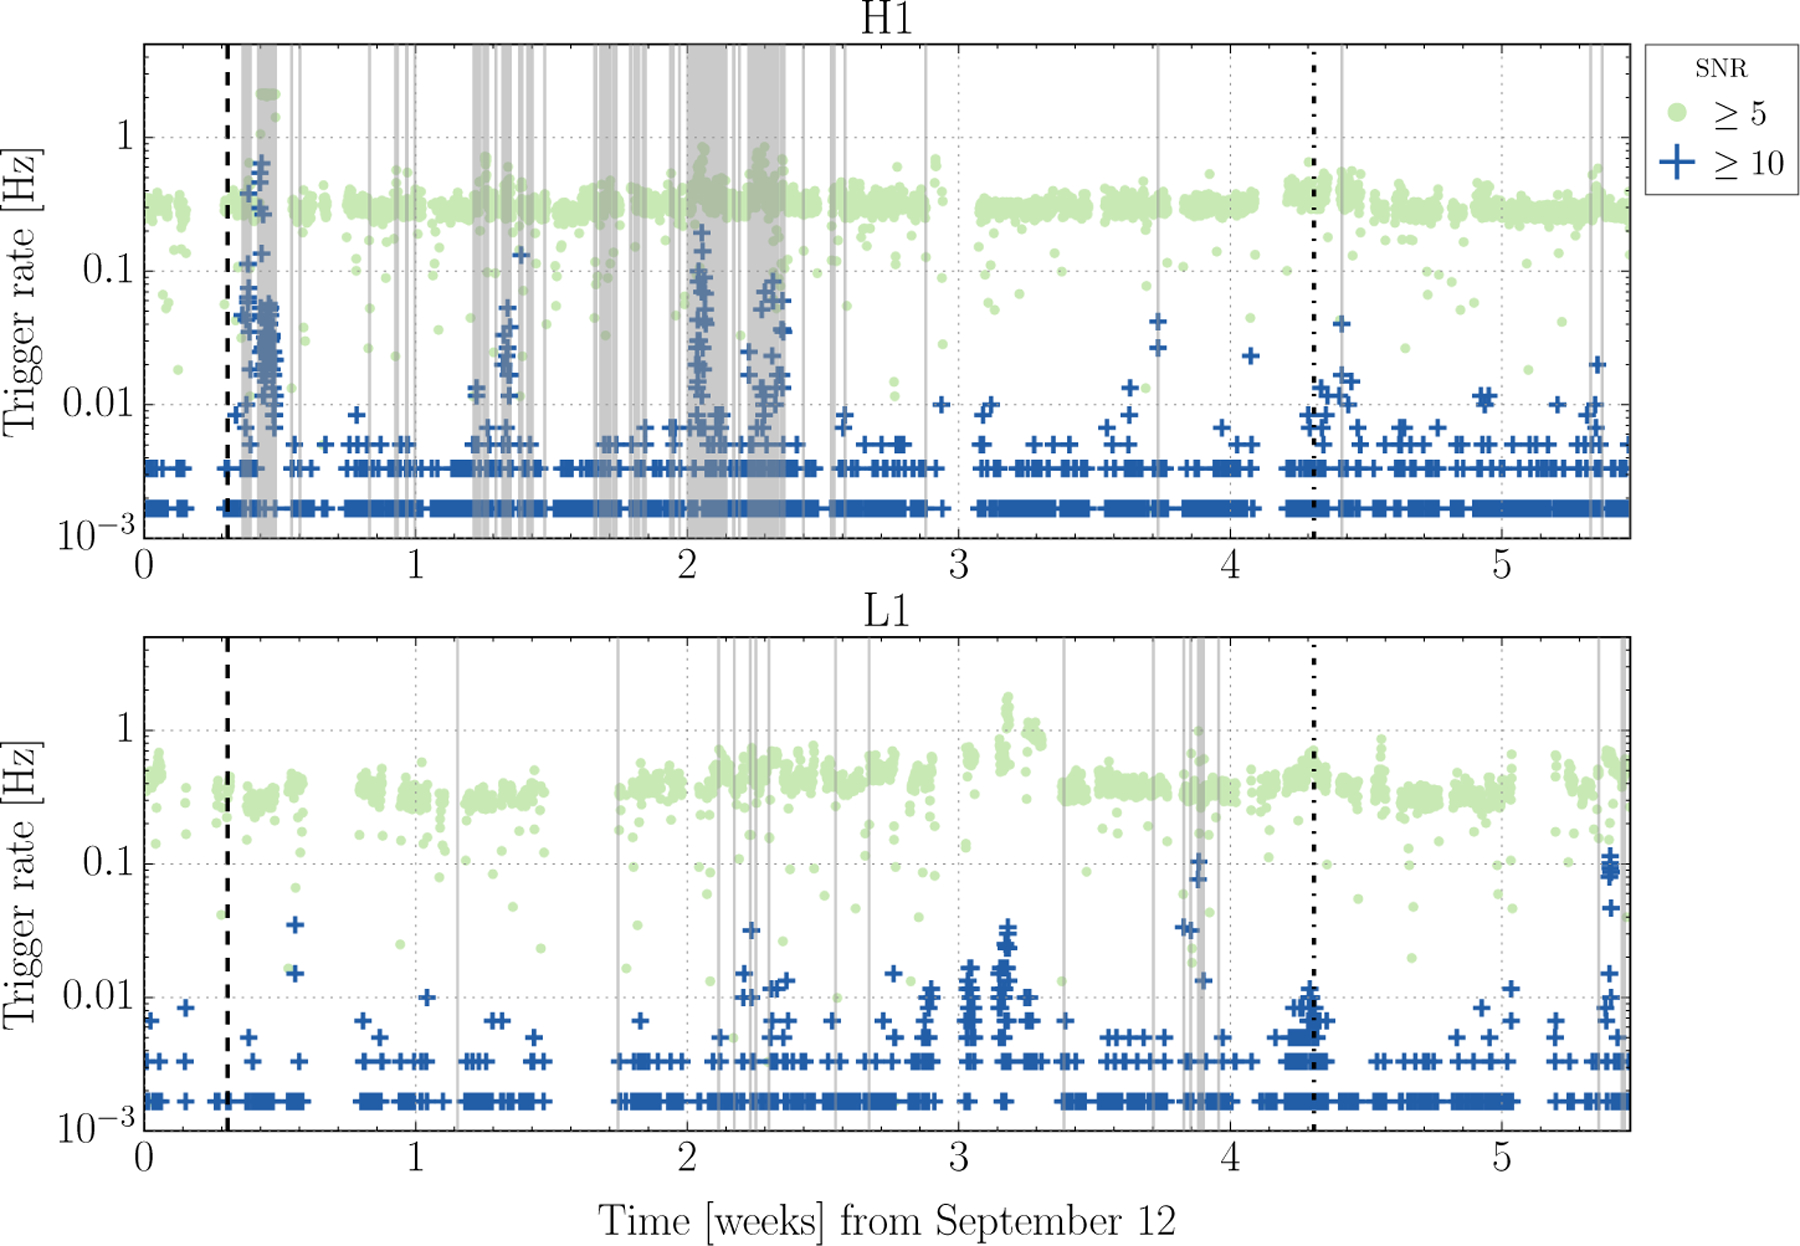
The rate of transient noise as witnessed by the single detector burst algorithm Omicron for the LIGO Hanford (above) and LIGO-Livingston (below) detectors. Each dot represents the average trigger rate over a 600 second interval. Green dots show triggers with an SNR above 5, and blue crosses show triggers with an SNR above 10. Time vetoed from the analysis period is indicated in gray. The time of GW150914 is indicated with a vertical dashed line and LVT151012 with a dot-dashed line.