
Figure 2:
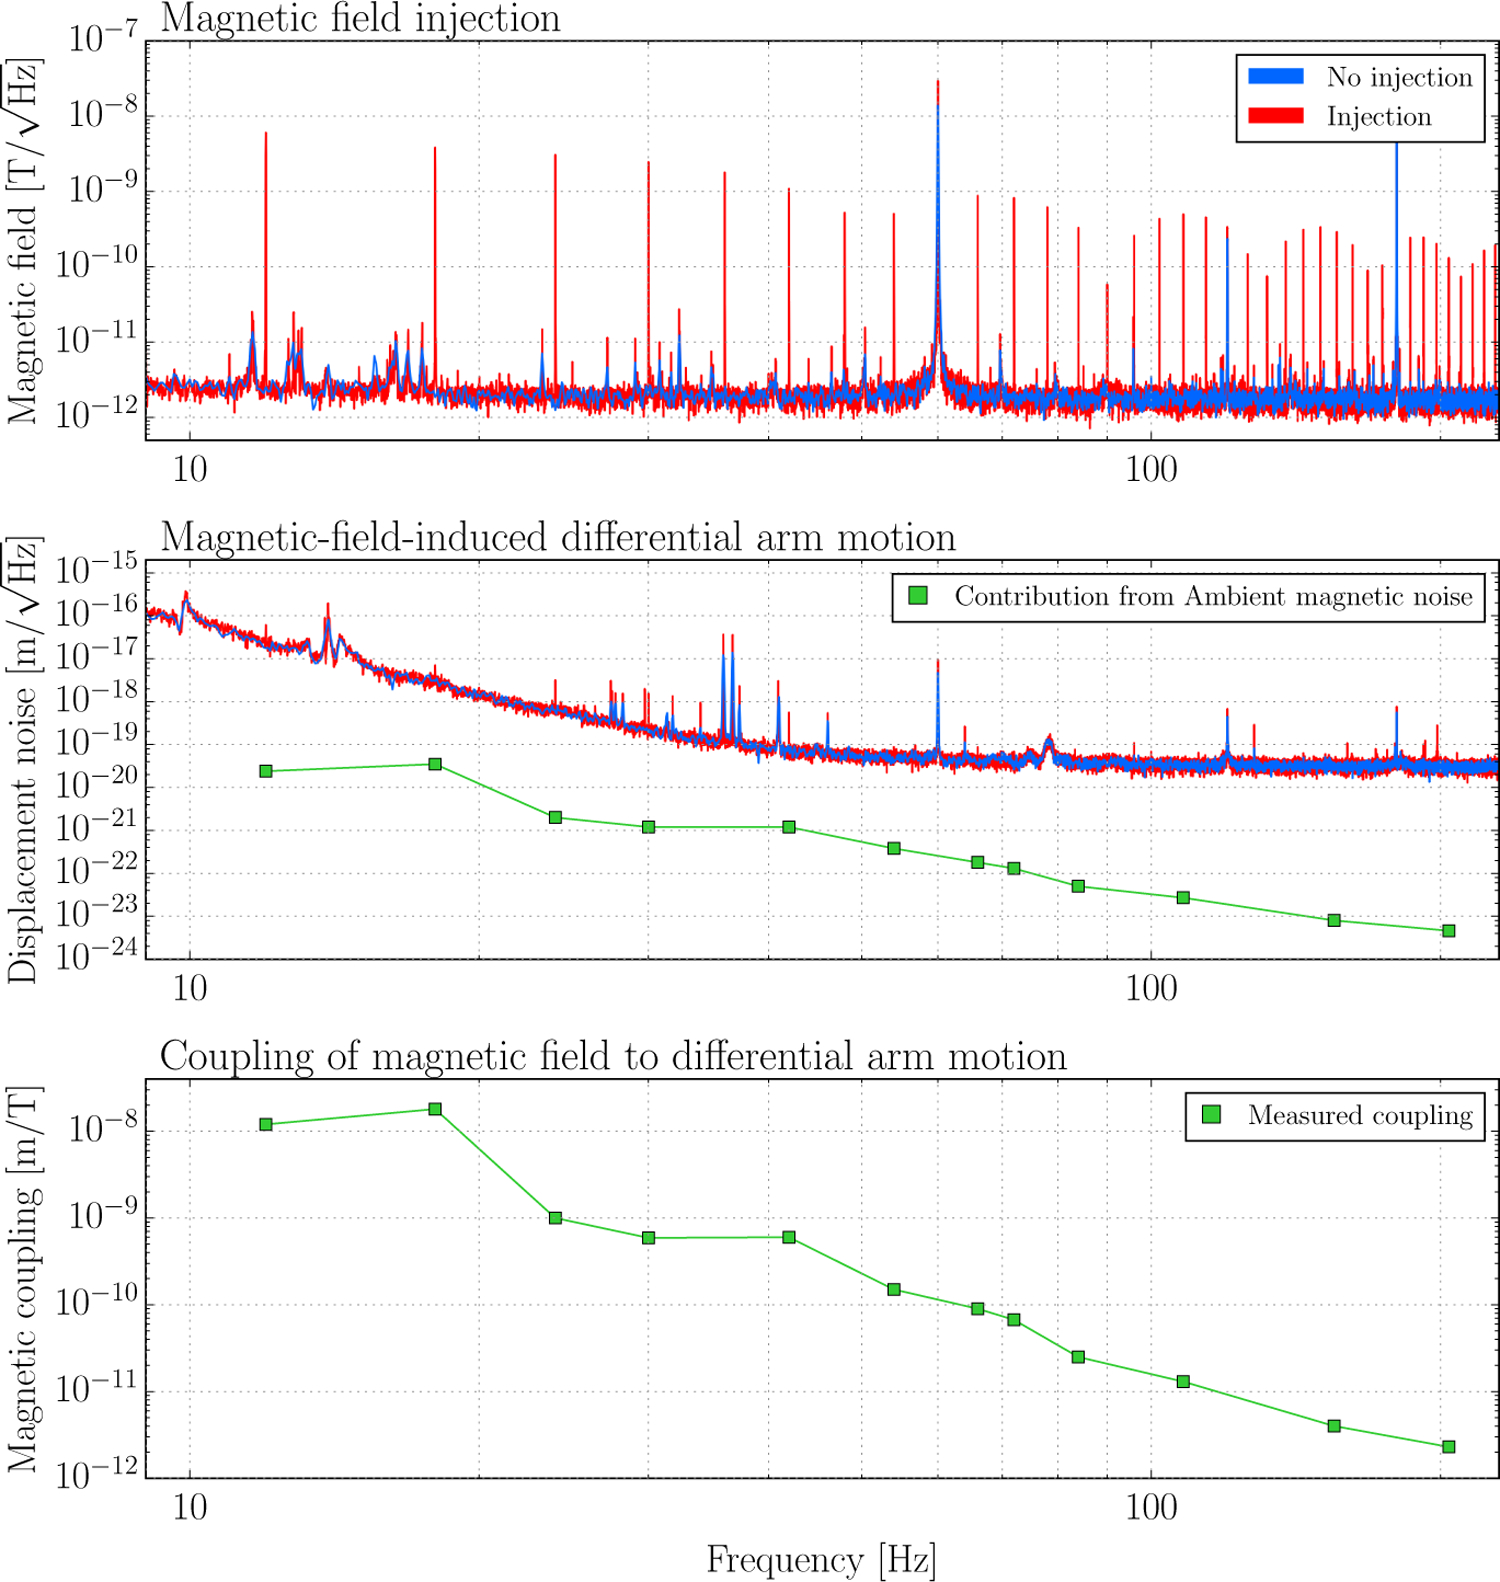
Noise coupling example: determining magnetic field coupling for a location at LIGO-Hanford. The top panel shows the output of a magnetometer installed in the corner station (see Figure B1) during the injection of a series of single frequency oscillating magnetic fields at 6 Hz intervals (in red) and at a nominally quiet time (in blue). The middle panel shows h(f) during this test (in red) and during the same nominally quiet time (in blue). The heights of the induced peaks in h(f) can be used to determine the magnetic coupling (in m/T) at those frequencies, as shown in the bottom panel. The points in the bottom panel above 80 Hz were determined in a different test with a stronger magnetic field needed to produce discernible peaks in h(f). The green points in the middle panel are an estimate of the contribution to h(f) from the ambient magnetic noise during the nominally quiet time, calculated using the coupling function from the bottom panel. Injection tests also induced strong magnetic fields above 200 Hz. At higher frequencies, coupling was so low that the injected fields did not produce a response in h(f), but were used to set upper limits on the coupling function. This figure only shows data for one (typical) location, but similar injections were repeated at all locations where magnetic coupling might be of concern.