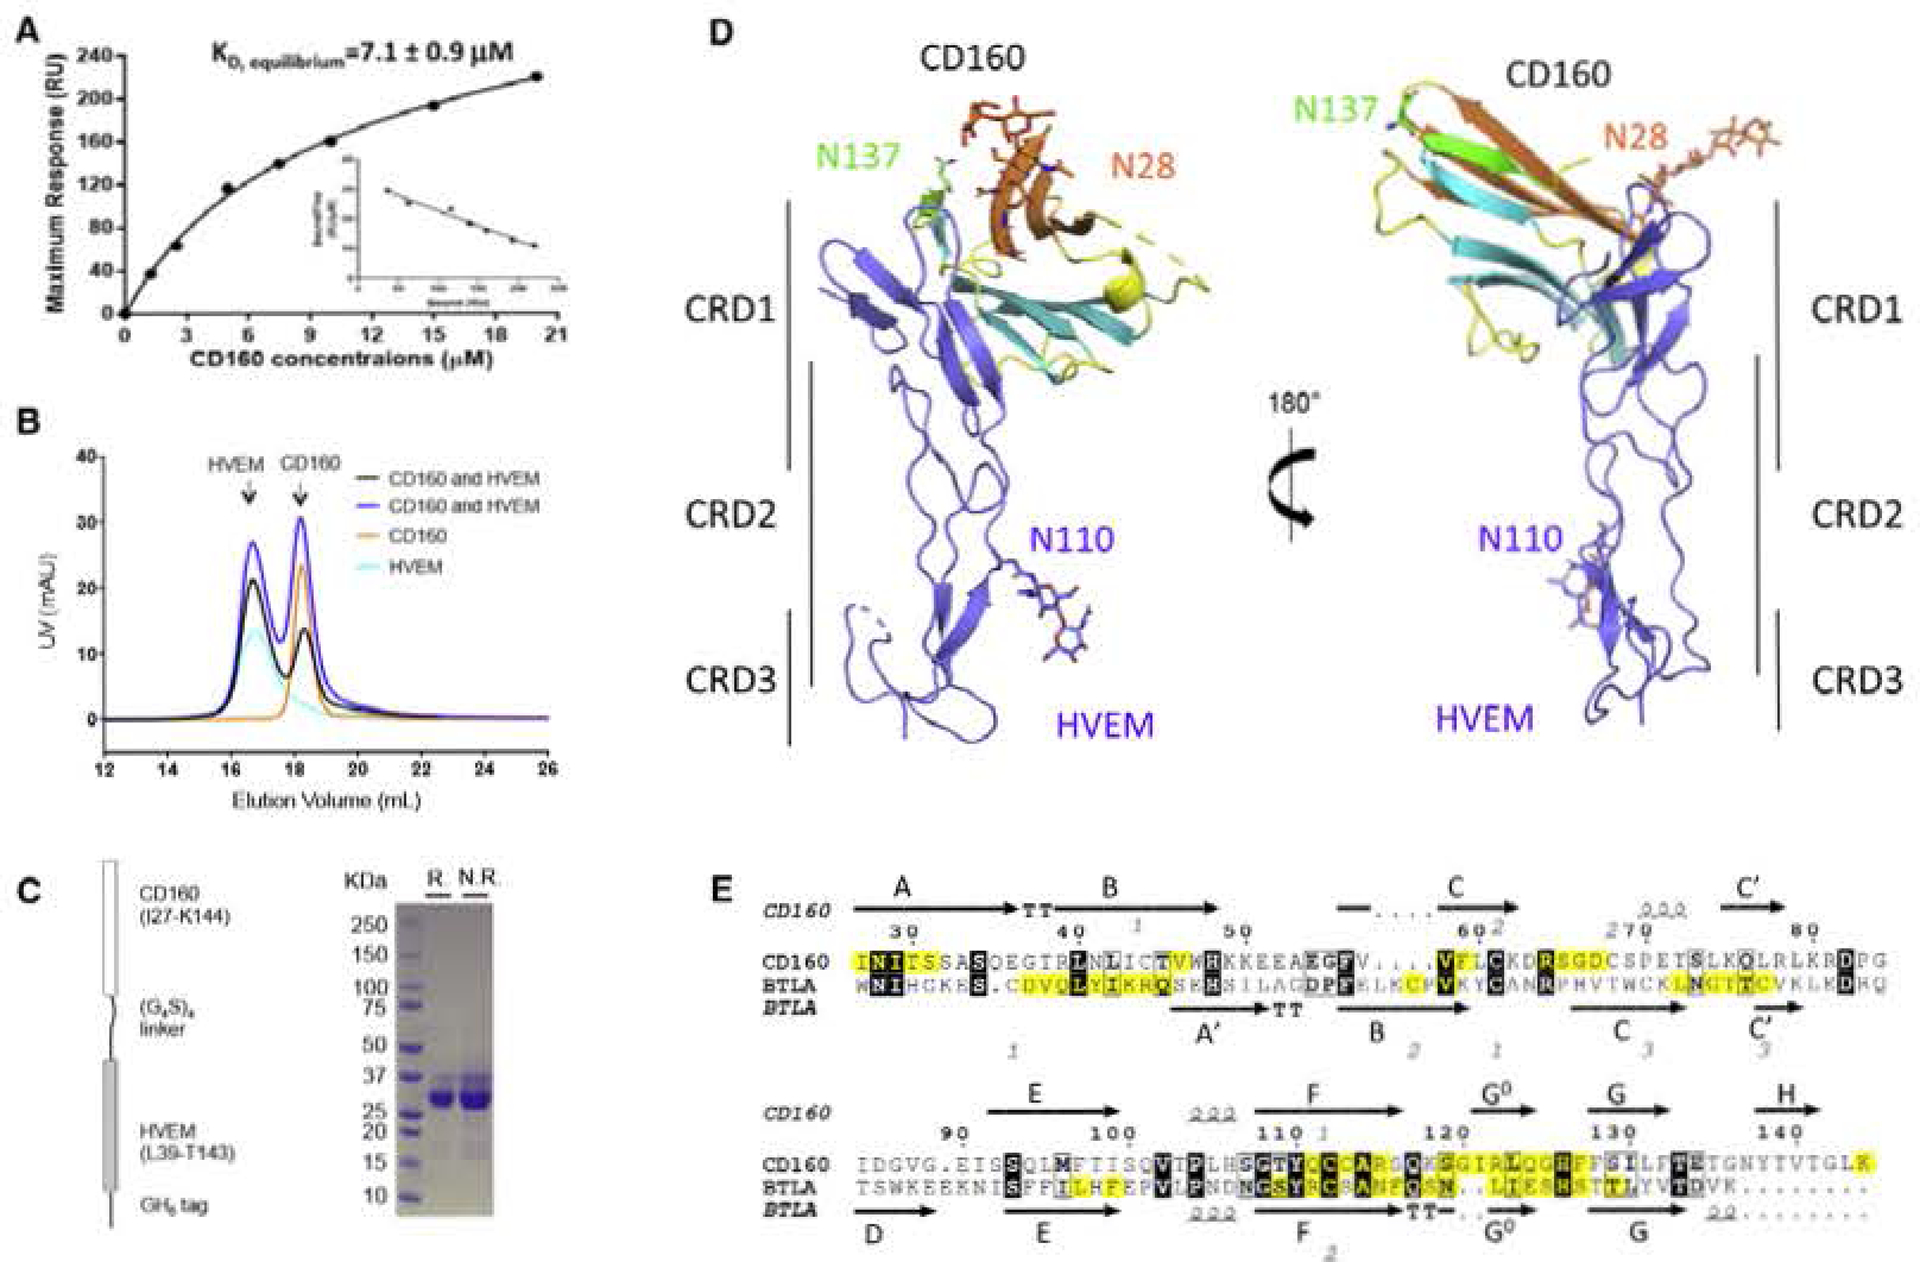
Figure 3. CD160 Interacts with HVEM in a Manner Similar to BTLA, but with Weaker Affinity.

(A) SPR results of injections of E. coli-derived CD160 across immobilized HVEM at various concentrations. The inset shows the linear regression between “Bound/Free” and “Bound” The reported values represent the average of three experiments with the standard deviation.
(B) SEC traces of CD160, HVEM and the mixtures of CD160 and HVEM in different molar ratios. These results indicate that CD 160 and HVEM do not form a stable complex in solution under the conditions examined.
(C) Schematic representation of the single-chain human CD160: HVEM complex as shown on the left panel. Right panel shows the SDS-PAGE result of the purified single-chain protein under reducing (R.) or non-reducing (N.R.) conditions.
(D) Overall structure of the single-chain CD16Q;HVEM complex. CD160 is colored and represented as in Figure 2; HVEM is shown in light blue. The carbohydrate modifications and the associated Asn residues are shown as sticks.
(E) Sequence alignment of human CD160 with human BTLA Ig domains. The secondary structure of CD160 and BTLA is presented (arrows indicate β strands and helical symbols indicate α. helices). Disulfide bonds are denoted by gray numbers near the cysteines. Residues in the binding interface are highlighted yellow. The sequence alignment was performed in the online server CLUSTALW and ESPript 3.0 (Robert and Gouet. 2014; Thompson et al., 1994).
See also Figure S2.
