
Figure 5.
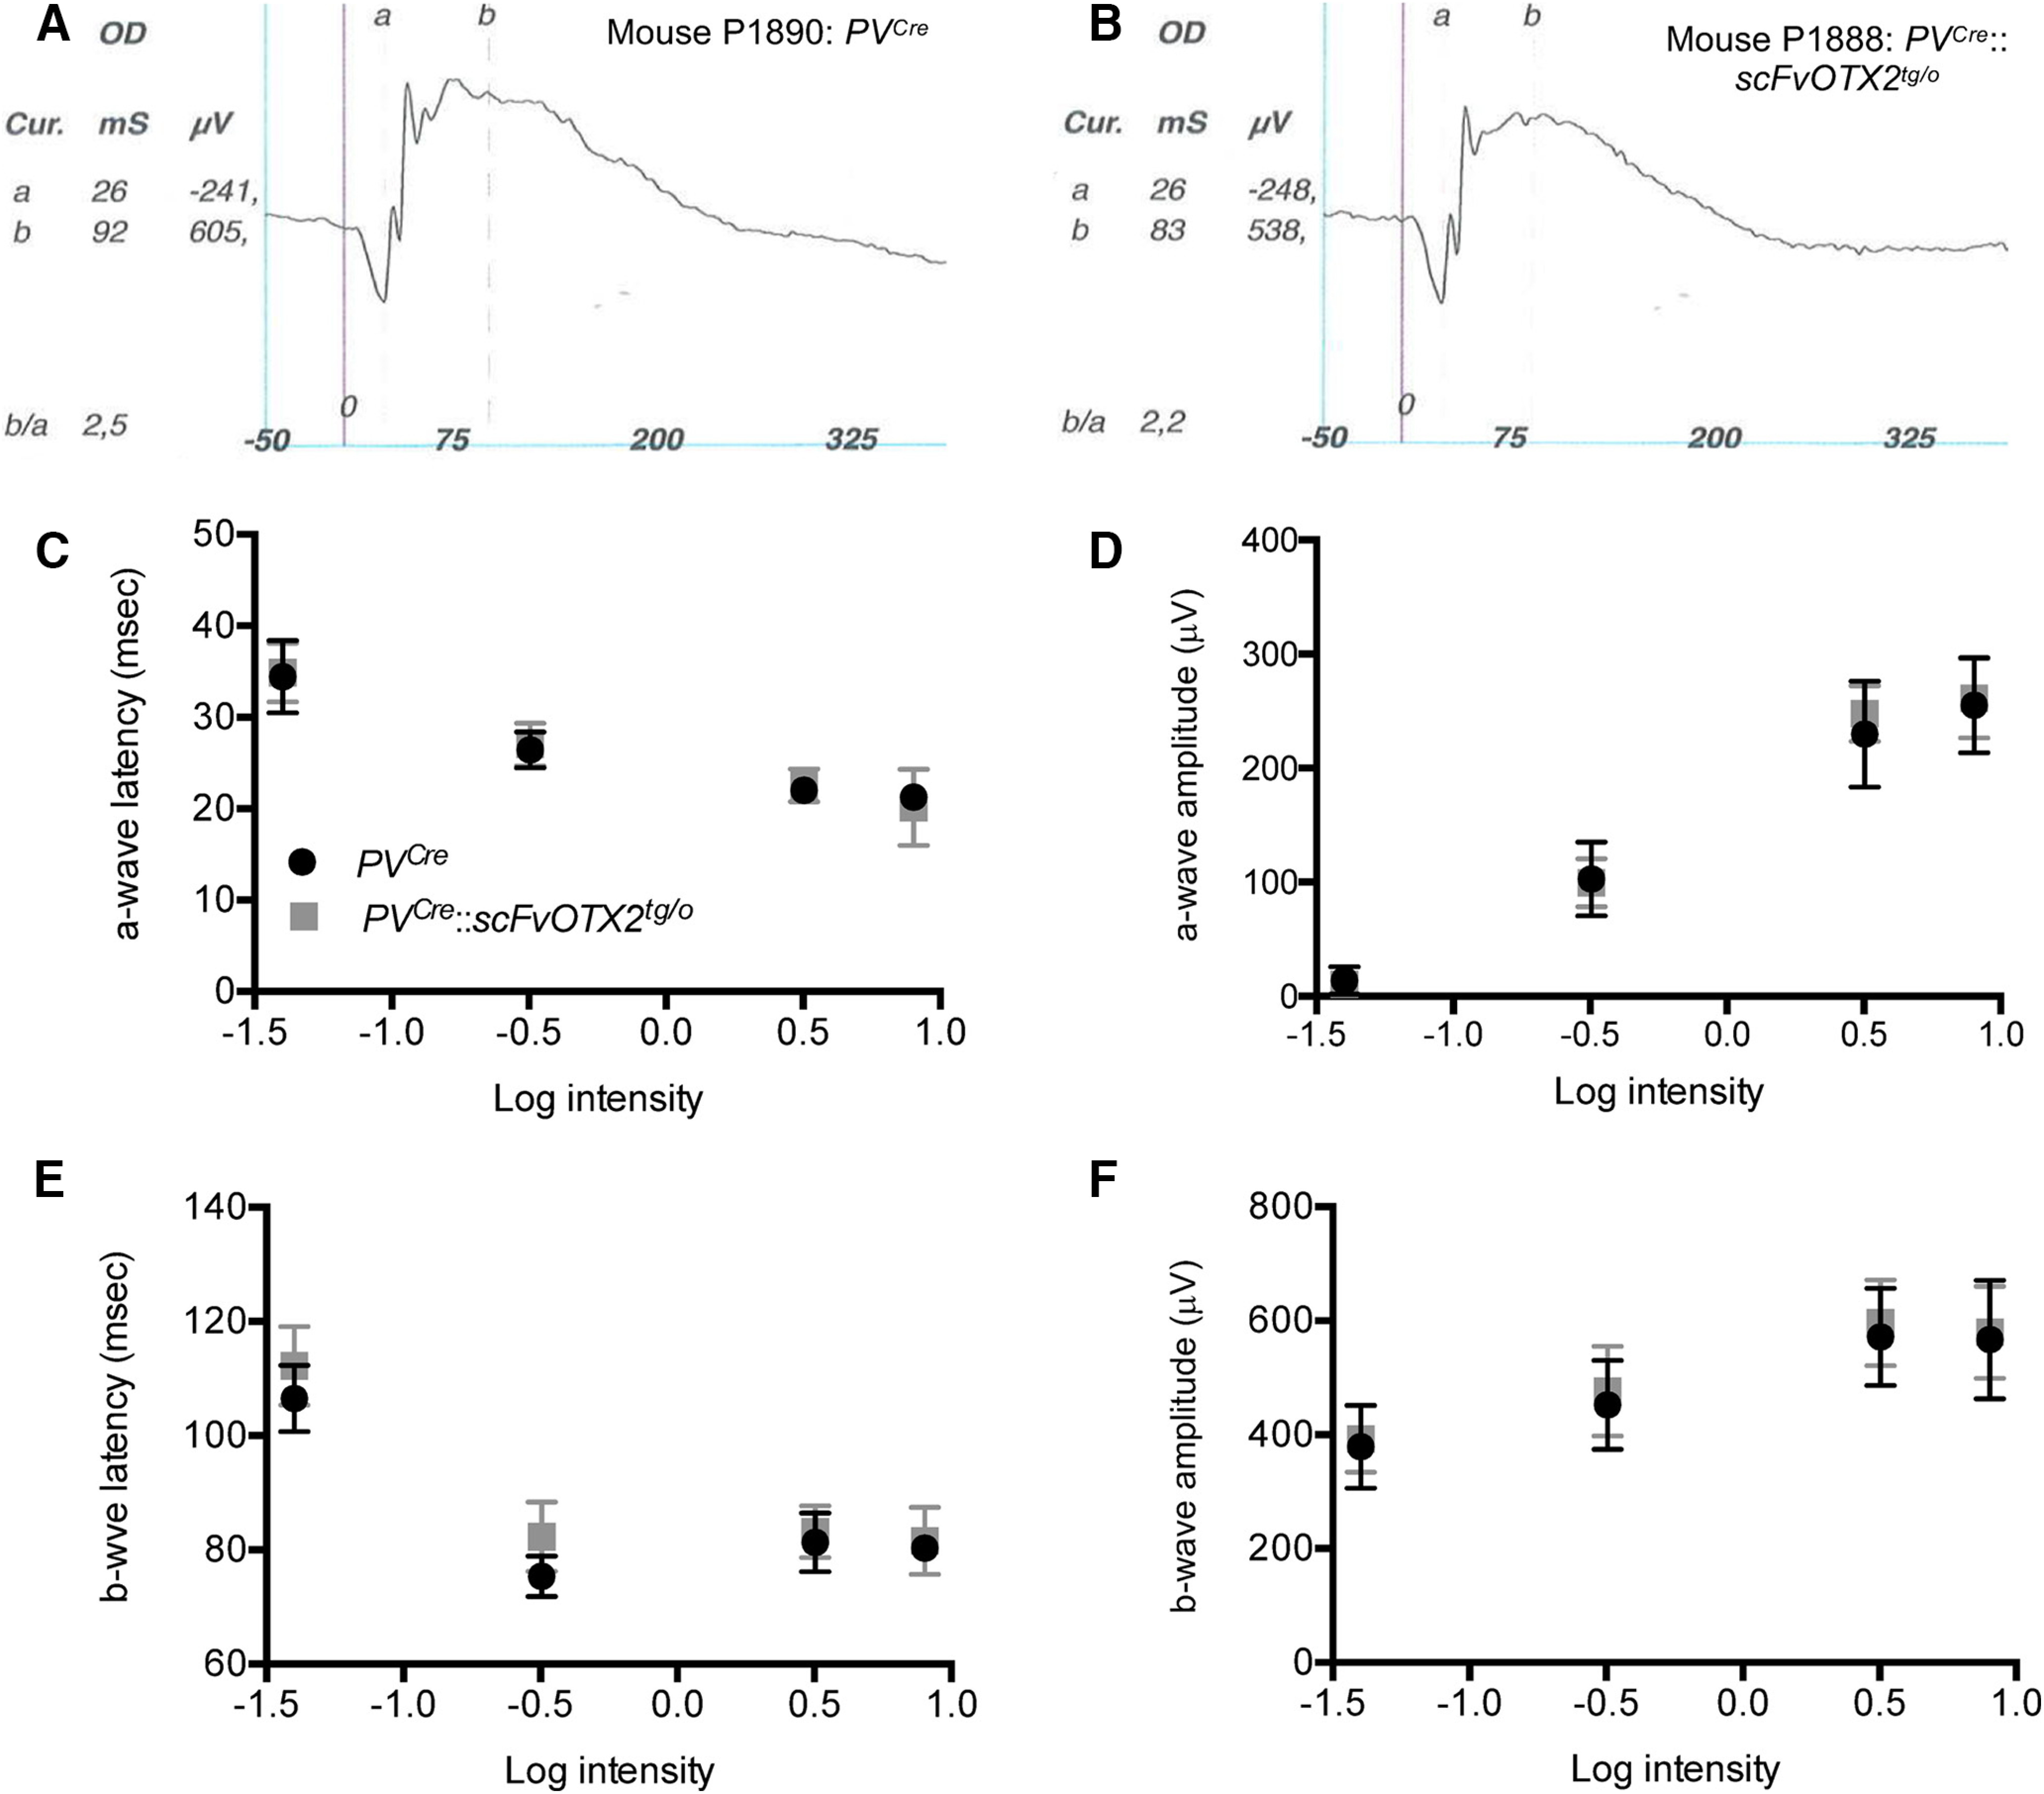
ERG of P30 mice expressing OTX2scFV and their PVCre littermates. A, B, Representative traces under scotopic conditions of the right eye at 3.19 cd/m2. C–F, Scotopic ERG parameters plotted against log intensity. Two-way ANOVA for repeated measures showed no significant differences based on genotype or genotype by intensity interaction (see text). N = 7 for PVCre mice and N = 9 for PVCre::scFvOTX2tg/o mice. Values: mean ± sd.