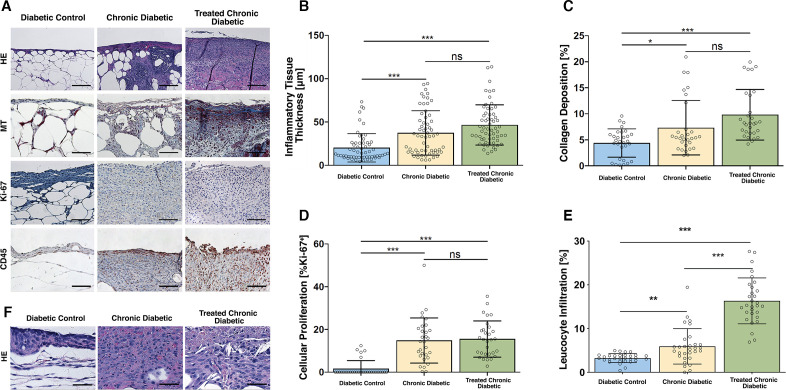
Figure 4.
Histological analysis. (A) Representative high power field sections of the wound bed, Day 10. H&E, MT, anti-Ki-67, and anti-CD45-stained wounds treated with ATZ, MSA, and occlusive dressing (Chronic diabetic), wounds treated with ATZ, MSA, a collagen-glycosaminoglycan implant plus occlusive dressing (Treated chronic diabetic), and wounds covered with occlusive dressing (Diabetic control) on day 10. The scaffold was excluded from the histology and analysis. Scale bar=µ100 m. (B) Inflammatory tissue thickness, day 10. A significant difference in inflammatory tissue thickness was shown between the Diabetic control group and both ATZ+MSA treated groups. The ATZ+MSA treated groups did not differ between each other. (C) Collagen deposition, day 10. A significant difference in collagen deposition was shown between the Diabetic control group and both ATZ+MSA treated groups. The ATZ+MSA treated groups did not differ between each other. (D) Cellular proliferation, day 10. A significant difference in cellular proliferation was shown between the Diabetic control group and both ATZ+MSA treated groups. The ATZ+MSA treated groups did not differ between each other. (E) Leukocyte infiltration, day 10. A significant difference in leukocyte infiltration was shown between the Diabetic control group and both ATZ+MSA treated groups. The ATZ+MSA treated groups significantly differed. (F) H&E high-power examination of wound bed, day 10. Neutrophils and macrophages are the main cellular infiltrate components. The scaffold was excluded from the histological analysis. Scale bar=µ50 m. *p<0.05, **p<0.01, ***p<0.001. ATZ, 3-amino-1,2,4-triazole; MSA, mercaptosuccinic acid; MT, Masson’s trichrome.

