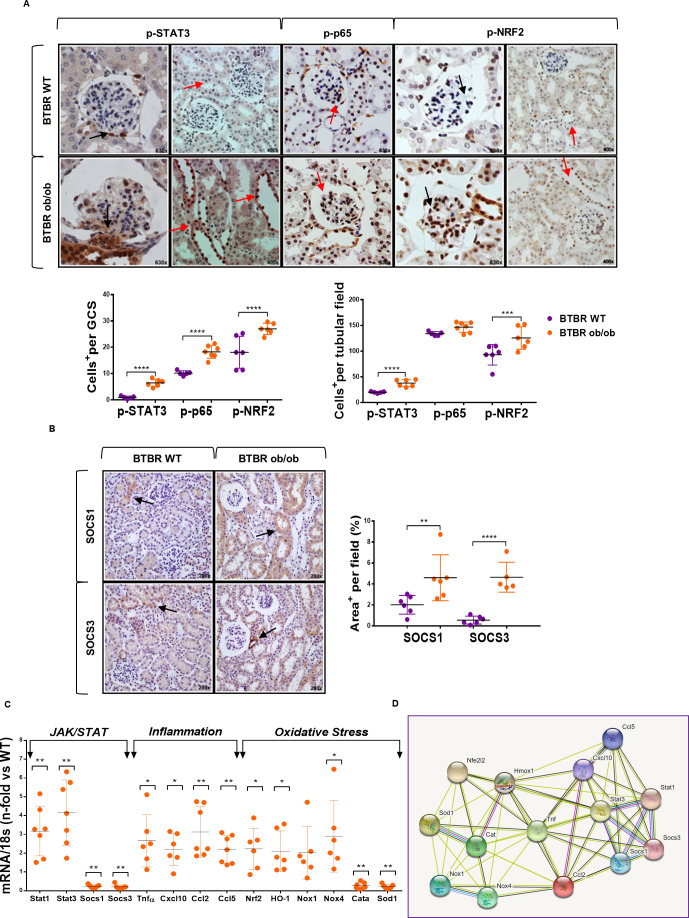
Figure 2.
JAK/STAT, inflammatory and oxidative stress pathways in kidney tissue of BTBR ob/ob model. (A) Representative images of phosphorylated (p-)STAT3, p-p65 NF-κB and p-NRF2, and quantification of positive cells in glomerular and tubular fields of BTBR WT and ob/ob mice. Magnification ×400 and ×630. Arrows indicate positive stained cells. (B) Representative images of SOCS1/SOCS3 proteins and quantification of positive stained area per tubular field. Magnification ×200. (C) Real-time PCR analysis of JAK/STAT, inflammatory and oxidative stress genes. Values normalized by endogenous control gene 18s are expressed as n-fold of the average value from BTBR WT. Data are shown as scatter dot plots and mean±SD of each group (n=5–7 mice/group); *p<0.05, **p<0.01, ***p<0.001, ****p<0.0001 versus BTBR WT control. (D) Schematic protein–protein interaction prediction of JAK/STAT, inflammatory and oxidative stress markers in Mus musculus according to STRING software. More information can be found at https://string-db.org/. a.u., arbitrary units; BTBR, black and tan brachyuric; GCS, glomerular cross section; JAK/STAT, Janus kinase/signal transducers and activators of transcription; NF-κB, nuclear factor-κB; NRF2, nuclear factor erythroid 2-related factor 2; ob/ob, obese/obese; SOCS, suppressor of cytokine signaling; WT, wild type.

