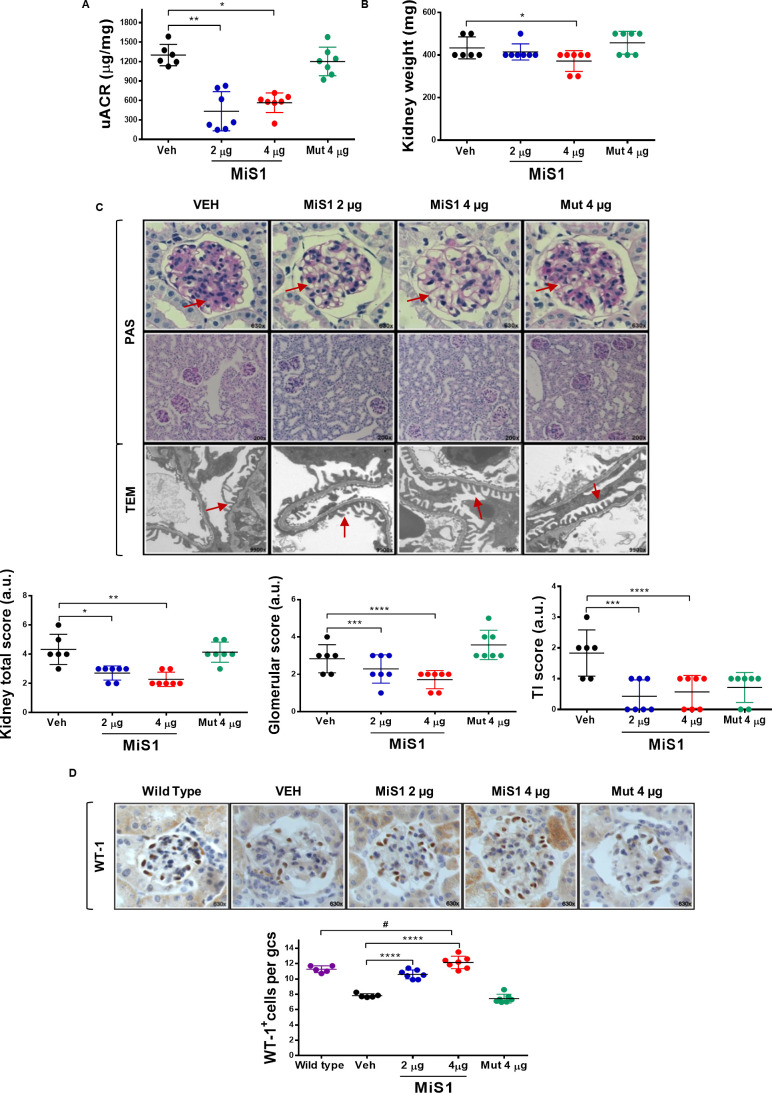
Figure 3.
MiS1 treatment reduces kidney damage markers in BTBR ob/ob model. Graphs and images represent the changes observed in diabetic mice treated with active MiS1 (2 µg and 4 µg) and inactive mutated peptide (Mut 4 µg) compared with vehicle controls (Veh). (A) Urinary albumin creatinine ratio (UACR). (B) Kidney weight. (C) Representative images of light microscopy of glomerular and tubular fields stained with PAS and the quantification of histopathological total score. Magnification ×200 and ×630. Additionally, TEM of glomerular filtration barrier was observed. Magnification ×9900. Arrows indicate areas of mesangial expansion (PAS images) and pedicelar effacement (TEM images). (D) Immunohistochemistry against WT-1 protein, used as podocyte marker. Graphs represent the average number of WT-1+ cells per glomerular cross section (GCS) in BTBR WT and ob/ob (vehicle and treatments). Magnification ×630. Data are shown as scatter dot plots and mean±SD of each group (n=5–7 mice/group); #p<0.05 versus BTBR WT; *p<0.05, **p<0.01, ****p<0.0001 versus diabetic vehicle control. a.u., arbitrary units; BTBR, black and tan brachyuric; ob/ob, obese/obese; PAS, periodic acid Schiff; TI, tubulointerstitial; TEM, transmission electron microscopy; WT-1, Wilms tumor protein-1.

