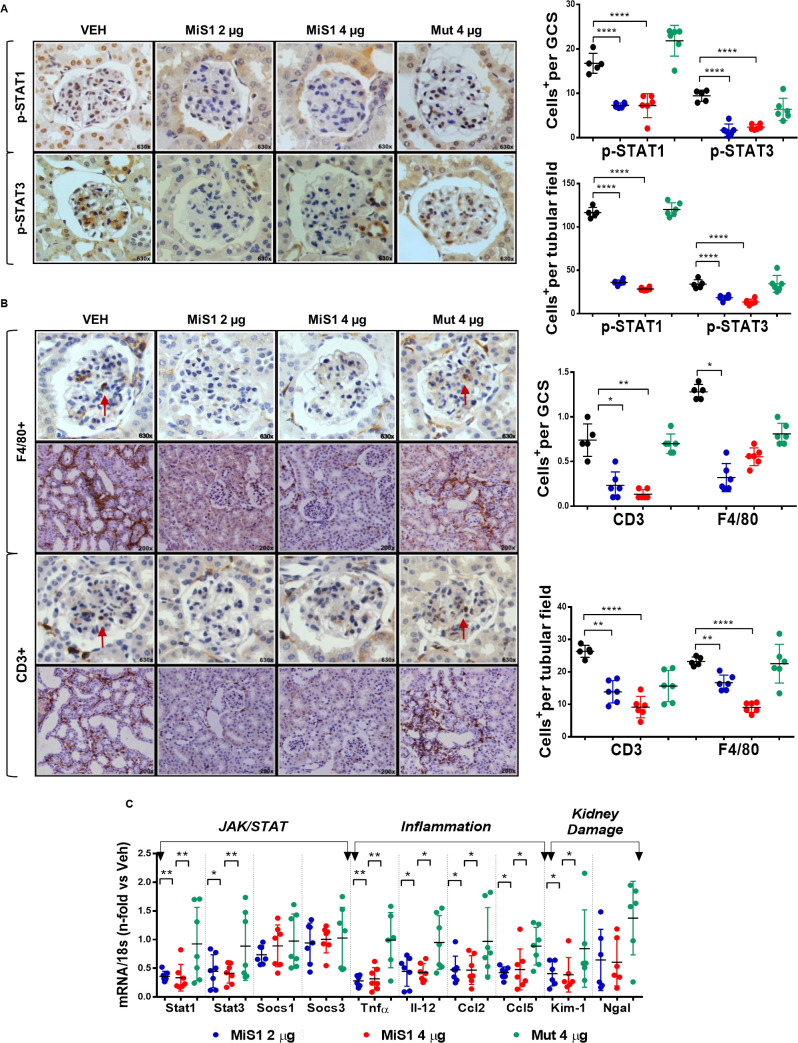
Figure 4.
MiS1 treatment inhibits kidney JAK/STAT activation and renal microinflammatory milieu in the BTBR ob/ob model. (A) Graphs and images represent the changes observed in JAK/STAT activation (p-STATs) in diabetic mice treated with active MiS1 (2 µg and 4 µg) and inactive mutated peptide (Mut 4 µg) compared with vehicle controls (Veh), quantified per number of positive cells p-STAT1+ and p-STAT3+, both at the glomerular and tubular fields. Magnification ×630. (B) Representative images of immunohistochemistry against F4/80 and CD3. Magnification ×200 and ×630. Graphs represent the quantification of average number of monocytes/macrophages F4/80+ and CD3+ T lymphocytes, both at the glomerular and interstitial fields. Arrows indicate positively stained cells. (C) Gene expression analysis of mRNA related with JAK/STAT pathway (Stat1, Stat3, Socs1 and Socs3), inflammatory cytokines (Tnfα and Il-12) and chemokines (Mcp-1 and Rantes), and kidney damage markers (Kim-1 and Ngal) were evaluated by real-time PCR, being normalized in each sample by endogenous control gene 18s and expressed as n-fold the average value obtained in the vehicle group (Veh). Data are shown as scatter dot plots and mean±SD of each group (n=6–7 mice/group); *p<0.05, **p<0.01, ****p<0.0001 versus diabetic vehicle control. BTBR, black and tan brachyuric; GCS, glomerular cross section; JAK/STAT, Janus kinase/signal transducers and activators of transcription; ob/ob, obese/obese.

