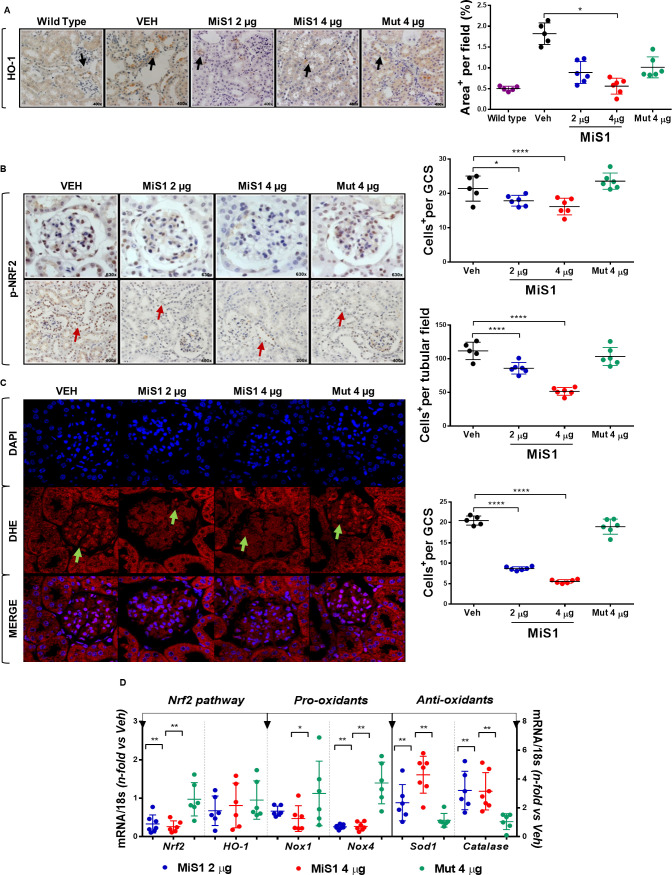
Figure 5.
MiS1 treatment modulates NRF2 activation, superoxide anion production and gene expression of redox balance markers in BTBR ob/ob model. (A) Graphs and images represent the changes observed in immunohistochemistry against heme-oxygenase-1 in BTBR WT, vehicle and each of the groups treated (2 µg, 4 µg and Mut 4 µg), quantified per analysis of percentage of the positive staining area per tubular field. Magnification ×400. (B) Graphs and images represent the changes observed in NRF2 activation (p-NRF2) in diabetic mice treated with active MiS1 (2 µg and 4 µg) and inactive mutated peptide (Mut 4 µg) compared with vehicle controls (Veh), quantified per number of positive cells p-NRF2+, both at the glomerular and tubular fields. Magnification ×200–×630. Arrows indicate positive staining. (C) Representative fluorescence images of superoxide anion (DHE, red), cell nuclei (DAPI, blue) and merge. Arrows show positive staining of superoxide anion at the glomerular level. Graph shows DHE-positive cells per glomerular field. Magnification ×630. (D) Gene expression analysis of mRNA related with Nrf2 pathway (Nrf2, HO-1), pro-oxidants enzymes (Nox1, Nox4) and antioxidants enzymes (Sod1, Catalase) was evaluated by real-time PCR. Values normalized by endogenous control gene 18s are expressed as n-fold of the average value obtained in the vehicle group (Veh). Data are shown as scatter dot plots and mean±SD of each group (n=6–7 mice/group); *p<0.05, **p<0.01, ****p<0.0001 versus diabetic vehicle control. BTBR, black and tan brachyuric; DAPI, 4′,6-diamidino-2-phenylindole; DHE, dihydroethidium; GCS, glomerular cross section; Mut 4 μg, inactive mutated peptide; NRF2, nuclear factor erythroid 2-related factor 2; ob/ob, obese/obese; WT, wild type.

