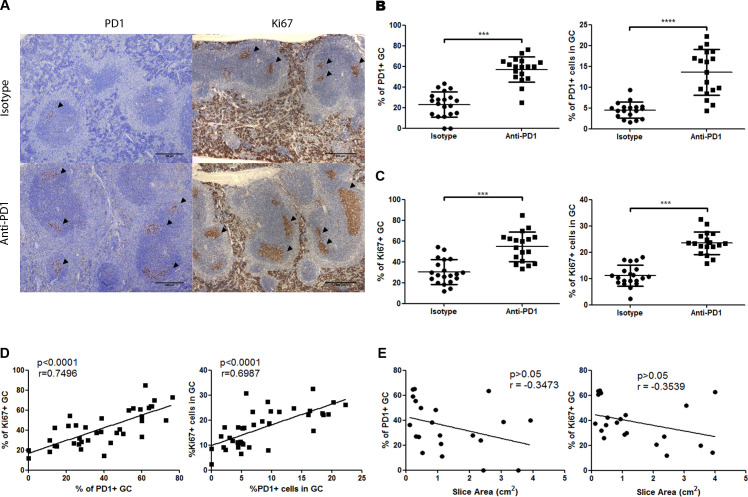
Figure 4.
Antiprogrammed cell death protein 1 (anti-PD-1) treatment induces germinal centers (GC) reaction in spleen. (A) Immunohistochemical images of spleen sections from isotype-treated or anti-PD-1-treated mice. Sections were stained for PD-1 and Ki67. Arrowheads indicate positive staining in GCs for PD-1 (left panels) and Ki67 (right panels). Scale bars represent 500 µm. (B) Left, percentage of PD-1+ GCs in spleen sections of anti-PD-1-treated and isotype-treated mice; right, average percentage of PD-1+ cells in GCs present in spleen sections from anti-PD-1-treated and isotype-treated mice (n=20 and n=18, respectively). (C) Left, percentage of Ki67 GCs in spleen sections of anti-PD-1-treated and isotype-treated mice; right, average percentage of Ki67+ cells in GCs present in spleen sections from anti-PD-1-treated and isotype-treated mice (n=20 and n=18, respectively). (D) Correlation between either percentage of Ki67 and PD-1+ GCs (left) or average Ki67 and PD-1 cells inside GCs (right) (n=38). Pearson’s r is shown for each correlation. (E) Correlation between tumor size and either percentage of PD-1+ GCs (left) or percentage of Ki67+ GCs (right) (n=21). Pearson’s r is shown for each correlation. ***P<0.001; ****p<0.0001.

