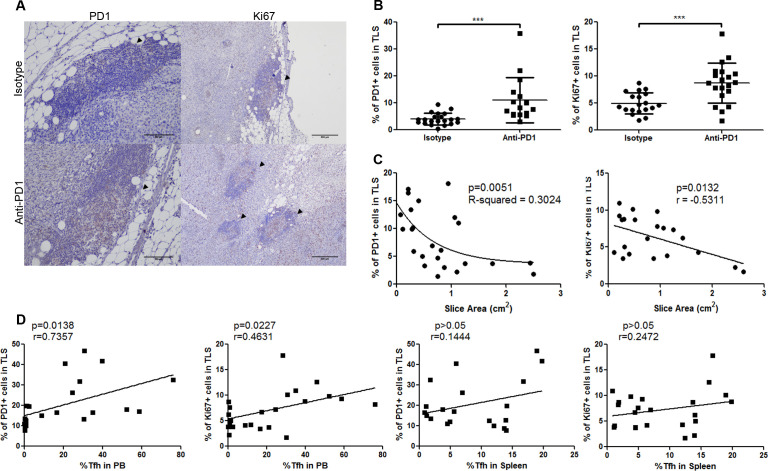
Figure 6.
Antiprogrammed cell death protein 1 (anti-PD-1) treatment promotes tertiary lymphoid structures (TLS) activation. (A) Immunohistochemical images of tumor sections from anti-PD-1-treated and isotype-treated mice stained for PD-1 (left panels) (n=21 and n=16, respectively) and Ki67 (right panels) (n=19 and n=20, respectively). Arrowheads indicate positive staining for PD-1 and Ki67, respectively. Scale bars represent 250 µm and 500 µm in left and right images, respectively. (B) Percentage of PD-1+ and Ki67+ cells in TLS from tumors of isotype-treated and anti-PD-1-treated mice. (C) Correlation between tumor size and percentage of either PD-1+ (left) (n=24) or Ki67+ (right) (n=21) cells in TLS. R-squared as a goodness-of-fit measure or Pearson’s r are shown. (D) From left to right, correlation between percentage of circulating T follicular helper cells (cTfh) and either PD-1+ (n=22) or Ki67+ (n=24) cells in TLS, and between percentage of spleen follicular helper T cells (Tfh) and either PD-1+ (n=20) or Ki67+ (n=23) cells in TLS. Spearman’s coefficient (first and third panels) or Pearson’s r (second and fourth panels) are shown for each correlation. ***P<0.001.

