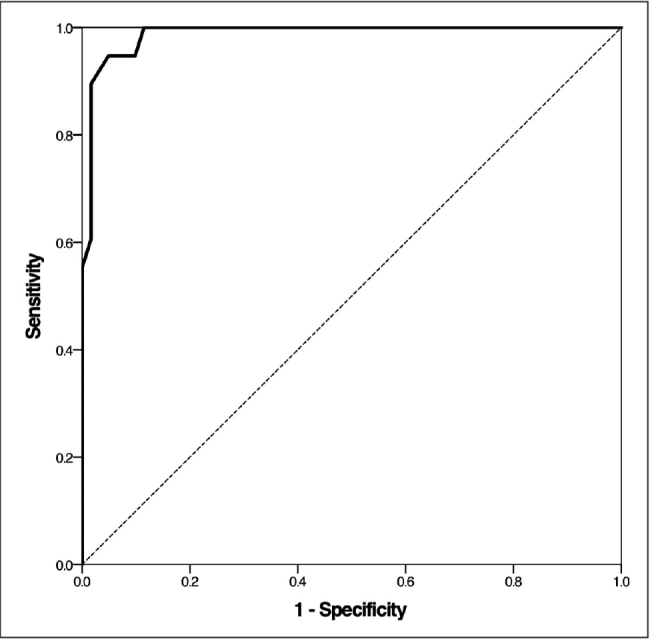
Figure 1.

COMQ-12 ROC curve.
Commentary: The area under the ROC curve (0.987) signifies outstanding diagnostic accuracy. A threshold score of 7 was determined to distinguish between chronic otitis media and a healthy ear. The ROC curve was created by plotting PCOMQ-12 and CTCOMQ-12.
