
Figure 3.
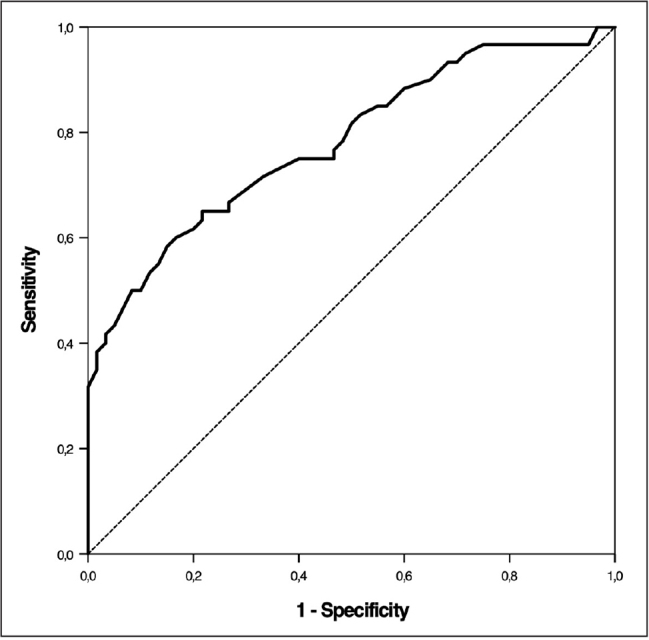
NVI ROC curve.
Commentary: The area under the ROC curve (0.781) signifies acceptable diagnostic accuracy. A threshold score of 56 was determined for the recognition of vertigo. The ROC curve was created by plotting PTNVI and CNVI.
Official websites use .gov
A
.gov website belongs to an official
government organization in the United States.
Secure .gov websites use HTTPS
A lock (
) or https:// means you've safely
connected to the .gov website. Share sensitive
information only on official, secure websites.
NVI ROC curve.
Commentary: The area under the ROC curve (0.781) signifies acceptable diagnostic accuracy. A threshold score of 56 was determined for the recognition of vertigo. The ROC curve was created by plotting PTNVI and CNVI.