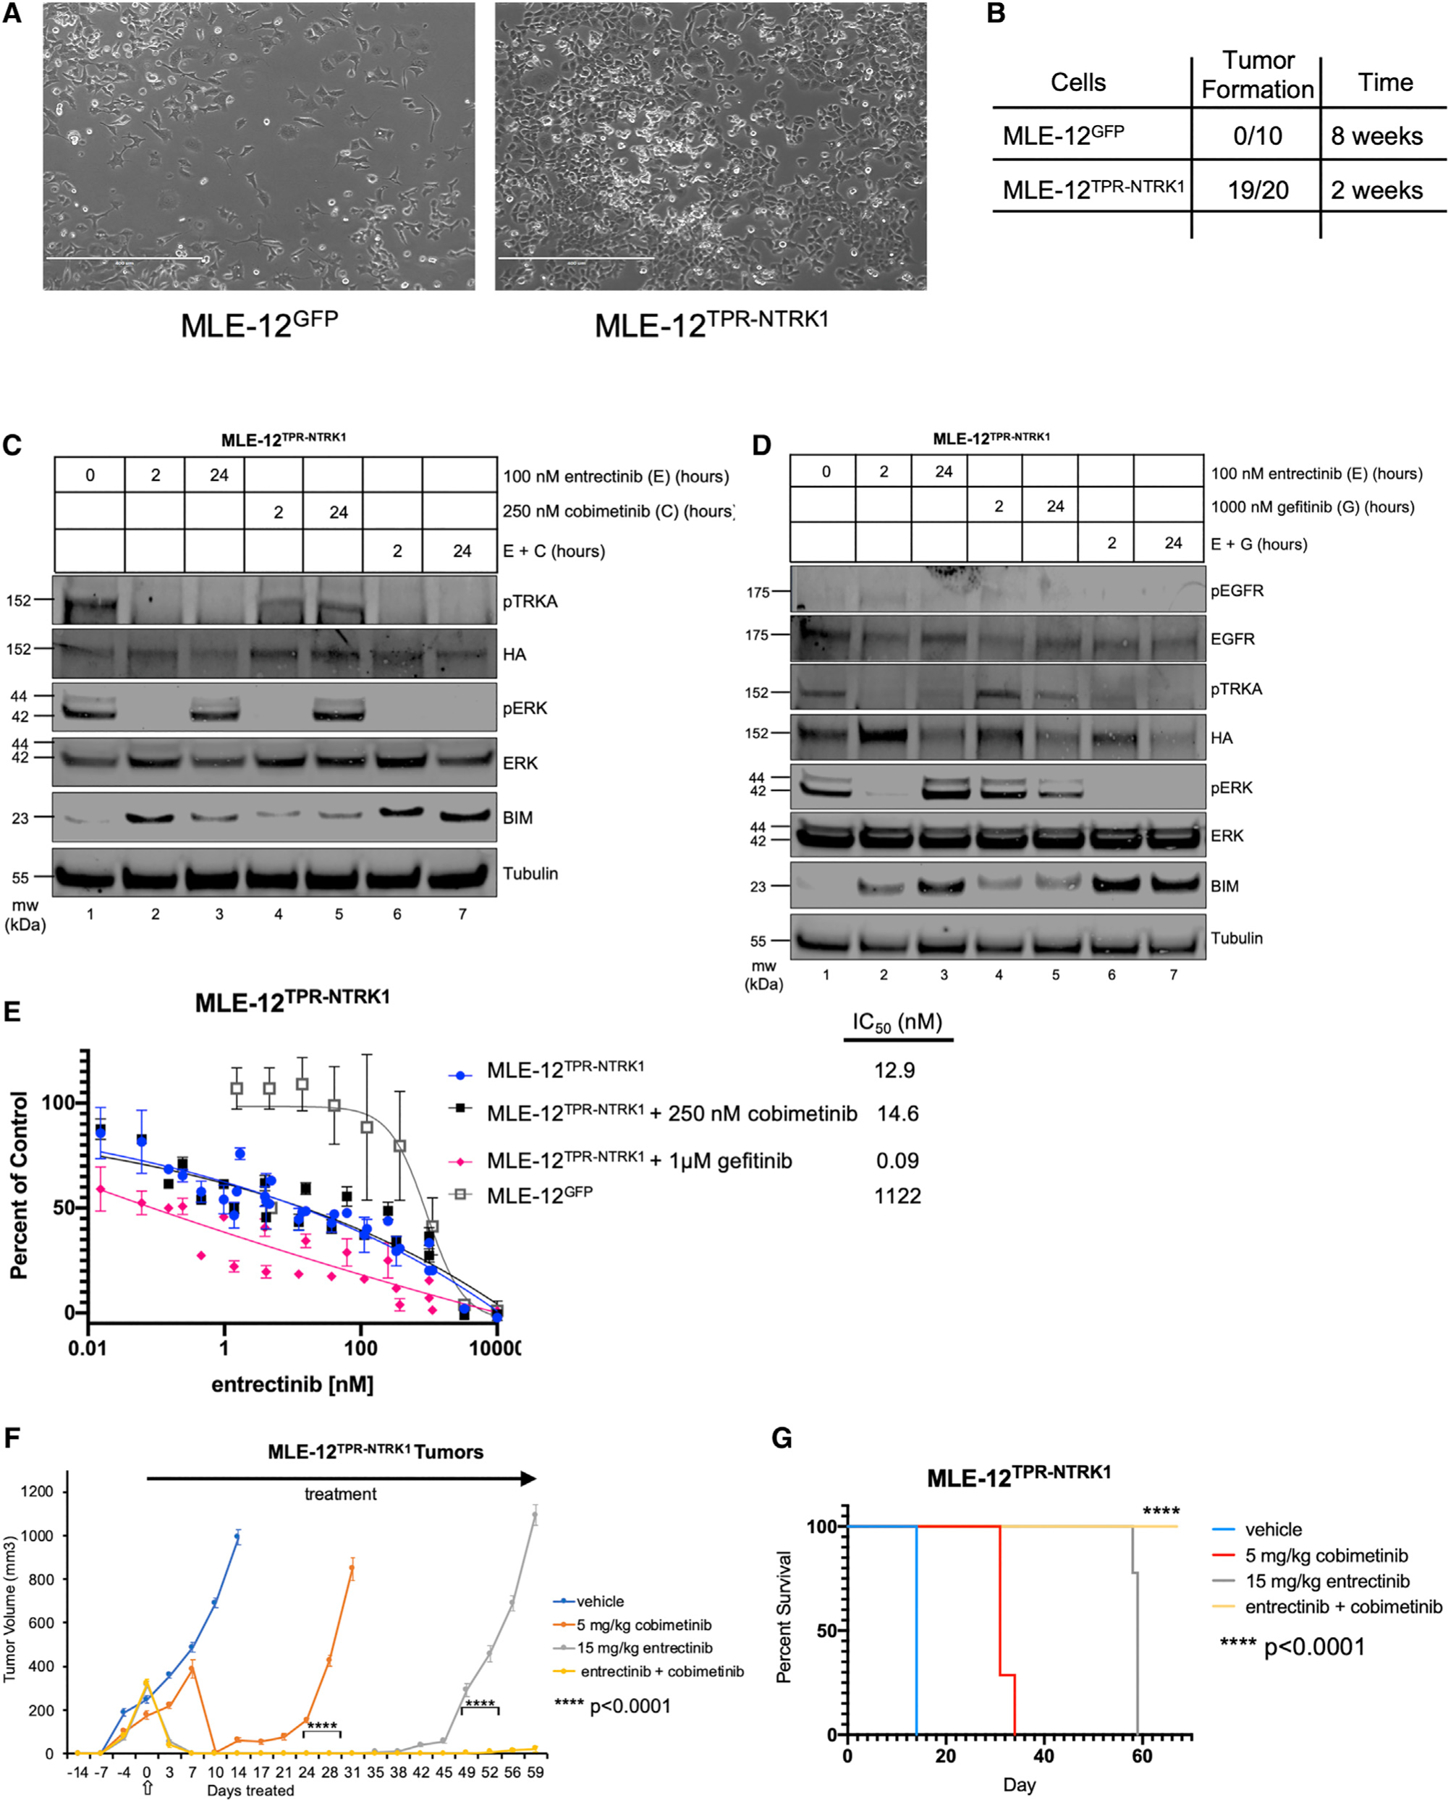
Figure 5. Generation of a MLE-12 Cell Line Model of Lung Cancer Driven by the TPR-NTRK1 Fusion Kinase.

(A) Phase contrast images (10x) of MLE-12TPR-NTRK1 or control MLE-12GFP cells grown under standard tissue culture conditions. Scale bars represent 400 μm.
(B) Quantification of subcutaneous tumor formation in NOD-SCID mice implanted with either 106 MLE-12TPR-NTRK1 or control MLE-12GFP cells assessed at either 2 or 8 weeks post-cell implantation.
(C) Immunoblot analysis of lysates of MLE-12TPR-NTRK1 cells treated with DMSO (0), entrectinib (100 nM), cobimetinib (250 nM), or entrectinib plus cobimetinib for either 2 or 24 h as indicated. Blots were probed with the indicated antibodies to assess the effects of the various treatments as indicated.
(D) Immunoblot analysis of lysates of MLE-12TPR-NTRK1 treated with DMSO, entrectinib (100 nM), gefitinib (1 μM), or the combination of entrectinib plus gefitinib for either 2 or 24 h as indicated. Blots were probed with the indicated antibodies to assess the effects of the various treatments as indicated.
(E) Curves of dose response of MLE-12TPR-NTRK1 or MLE-12GFP cells to treatment with a dose range of entrectinib either alone or in combination with a fixed dose of cobimetinib (250 nM) or a fixed dose of gefitinib (1 μM). Calculated IC50 values are listed. Error bars represent the SEM.
(F) Quantification of tumor burden overtime in immunocompromised NOD-SCID mice implanted with MLE-12TPR-NTRK1 cells treated q.d. with vehicle (blue), 5 mg/kg cobimetinib (orange), 30 mg/kg entrectinib (gray), or the combination of cobimetinib plus entrectinib (yellow). Arrows indicate the initiation and duration of drug treatments. Error bars represent the SEM. Statistical analysis was performed using a one-way ANOVA, where ****p < 0.0001. n = 40 mice.
(G) Kaplan-Meier survival curve comparing the effects of each inhibitor used in (F) on survival of each arm using the same color scheme. Statistical analysis was performed using a log rank Mantel-Cox test, where ****p < 0.0001.
