
Figure 2.
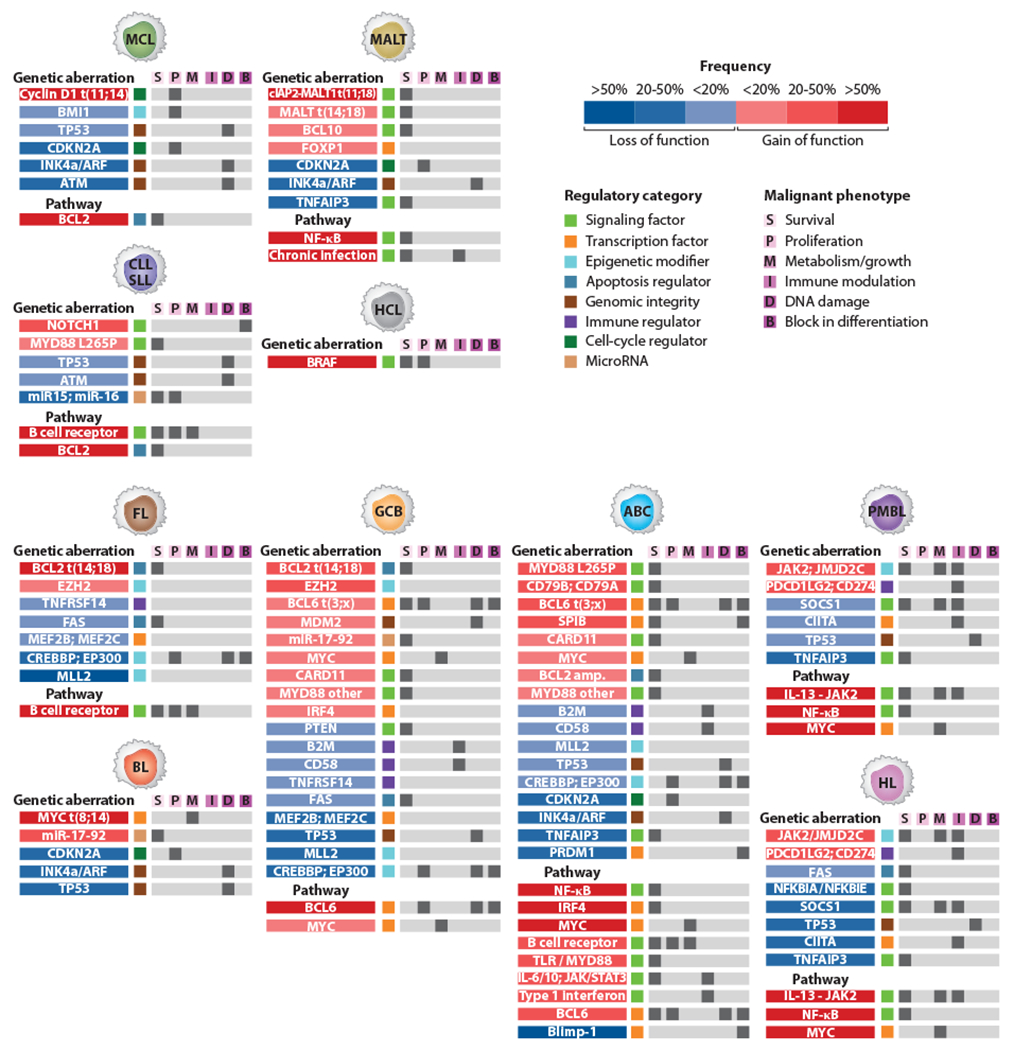
Summary of the characteristic molecular features of mature B cell malignancies. For each disease, the top panels represent recurrent genetic aberrations (copy number gain/loss, translocation, mutation, DNA methylation) that produce gain-of-function (red) or loss-of-function (blue) phenotypes. The bottom panels illustrate pathways or genes that are critical for the survival, proliferation, or other malignant phenotypes of each cancer subtype. Genes and pathways are classified according to regulatory category and malignant phenotypes as indicated. For abbreviations of lymphoma subtypes, see Figure 1a. Information for this figure was gleaned from the following references: MCL (3, 251, 354), MALT (1, 18), CLL/SLL (5, 134), HCL (333), FL (263, 268, 269, 362), BL (6, 236, 363), GCB (39, 157, 201, 225, 234, 263, 268, 269, 278, 353, 364, 365),ABC (35, 36, 39, 52, 53, 98, 106, 137, 199, 201, 225, 263, 278, 366, 367; A. Shaffer & L. Staudt, unpublished observations), PMBL (2), HL (4, 280, 306).