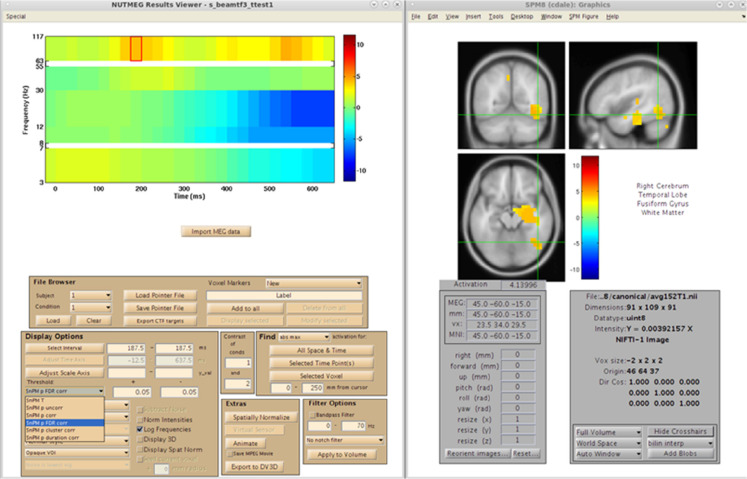
FIGURE 11.
Results from the group analysis using the time-frequency optimized beamformer comparing face to non-face conditions (Nutmeg In-Practice, Example 2). An early increase in high-gamma power (63–117 Hz) localized to the right fusiform is greater in the face condition around 187.5 ms following stimulus presentation.

