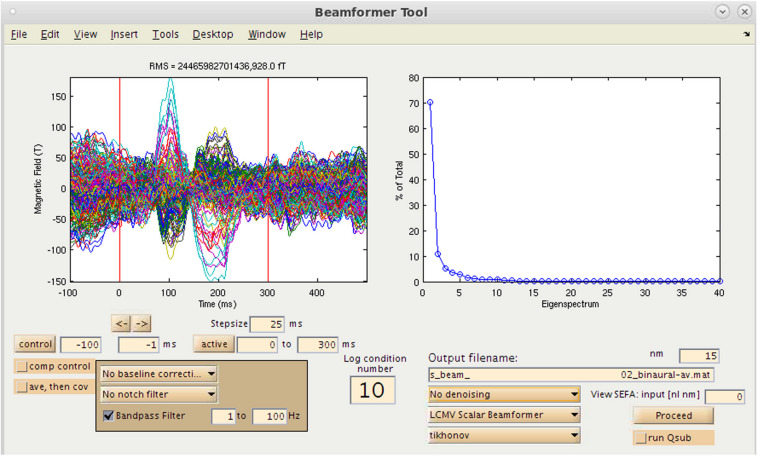
FIGURE 5.
Time-series source estimation GUI. On the left, sensor overlay of the averaged dataset is visible. On the right, parameters for source space reconstruction (in this case, eigenvalues plotted for the eigenspace vector beamformer). Filtering options, time window selection, method of source inversion, other denoising methods, sensor covariance regularization are also selectable.

