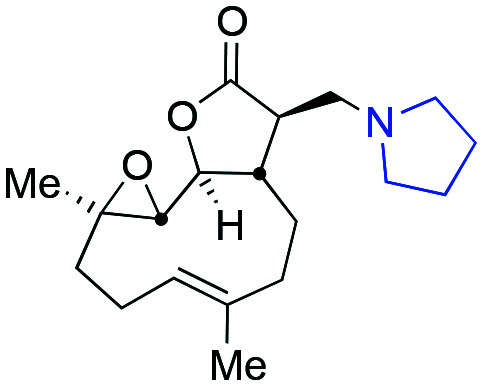
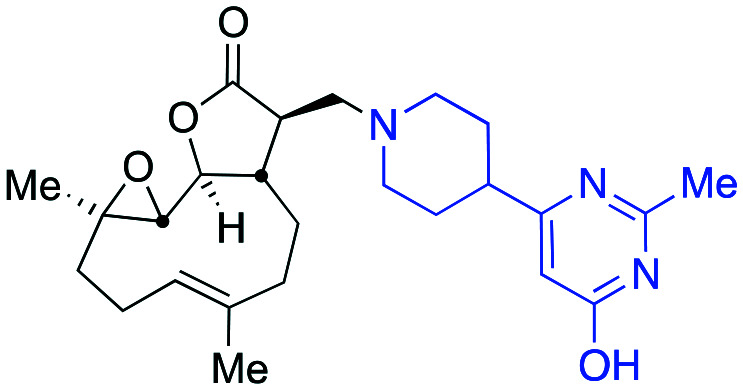
Table 2. Data obtained from murine in vivo pharmacokinetic study, concentrations of 5a and 5f (IV (1 mg kg–1) and PO (10 mg kg–1)). Data represented graphically in Fig. 4 .
| Entry | Compound | EC50 ave./μM | Mouse PK (IV) |
Mouse PK (PO) |
||||||
| Cl/mL min–1 kg–1 | T 1/2/h | VSS/L kg–1 | UC (0-inf)/ng h mL–1 | T max/h | C max/ng mL–1 | F% | UC (0-inf)/ng h mL–1 | |||
| 1 |

|
7.7 | 207 | 0.66 | 11.6 | 80.5 | 0.5 | 283 | 95.8 | 711 |
| 2 |

|
7.7 | 58 | 1.14 | 4.62 | 289 | 1 | 404 | 58.5 | 1696 |
