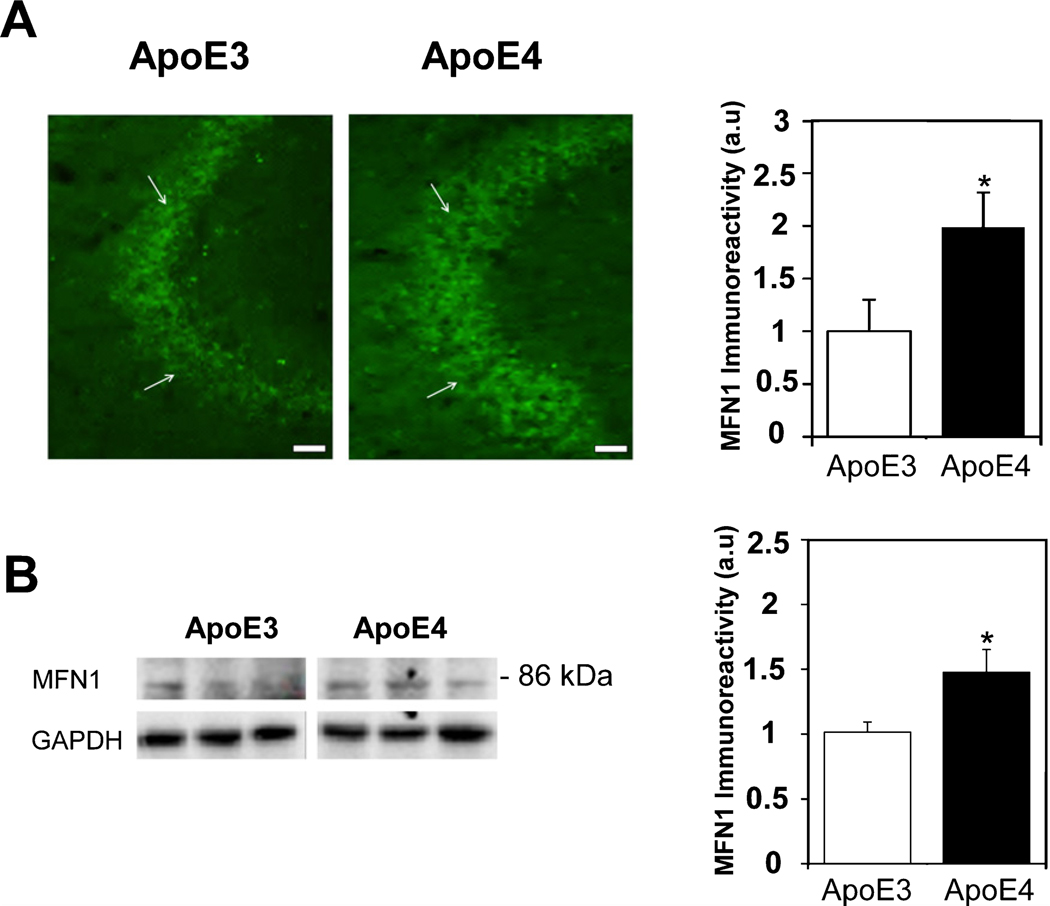
Fig. 1.
The levels of Mitofusin-1 (MFN1) in the hippocampus of ApoE3 and ApoE4 female mice. A) MFN1 immunohistochemistry. Representative images (X20 magnification) of the indicated CA3 hippocampal subfields of the indicated CA3 hippocampal subfields of 4-month-old ApoE3 and ApoE4 mice are presented on the left. White arrowheads represent CA3 pyramidal cells. Scale Bar = 50 μm. Quantification of the staining intensity in the CA3 pyramidal cells is shown on the right. Mean±SEM: n = 10 for ApoE3 (white bars) and n=15 for ApoE4 mice (black bars); *p<0.05, for ApoE4 compared to ApoE3. B) Representative immunoblots using MFN1 antibodies of ApoE3 and ApoE4 mouse whole hippocampal homogenates are presented on the left. GAPDH was used as a control for loading levels. Quantification of the results (mean±SEM; n=15 per group) of ApoE3 mice (white bars) and ApoE4 mice (black bars) is depicted on the right (*p<0.05).

