
Fig. 1.
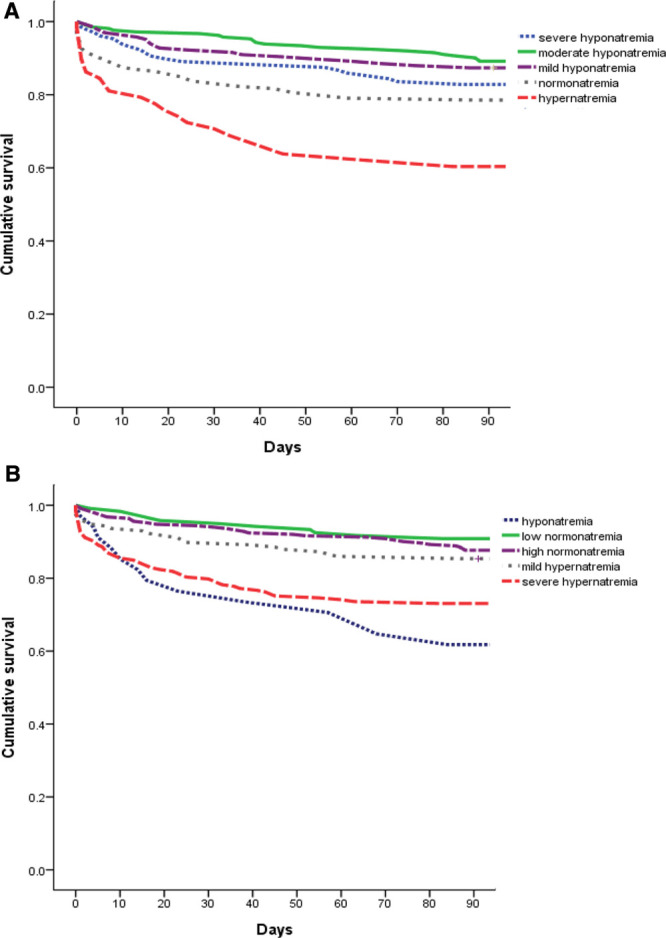
A, Kaplan–Meier curves of unadjusted cumulative survival according to the measured sodium level. The participants were categorized into five groups for measured sodium levels, and defined as severe measured hyponatremia (Na ≤ 125 mmol/L), moderate measured hyponatremia (Na = 126–130 mmol/L), mild measured hyponatremia (Na = 131–134 mmol/L), measured normonatremia (Na = 135–145 mmol/L), and measured hypernatremia (Na ≥ 146 mmol/L). There was a significant trend toward decreasing survival from the moderate measured hyponatremia to the measured hypernatremia (log-rank test for trend p < 0.001). B, Kaplan–Meier curves of unadjusted cumulative survival according to the corrected sodium level. The participants were categorized into five groups for corrected sodium levels, and defined as corrected hyponatremia (corrected Na <135 mmol/L), low corrected normonatremia (corrected Na = 135–139.9 mmol/L), high corrected normonatremia (corrected Na = 140–144.9 mmol/L), mild corrected hypernatremia (corrected Na = 145–149.9 mmol/L), and severe corrected hypernatremia (corrected Na ≥150 mmol/L). There was a significant trend toward decreasing survival from the low corrected normonatremia to the severe corrected hypernatremia (log-rank test for trend p < 0.001). Furthermore, corrected hyponatremia had higher risk of 90-day mortality compared with low corrected normonatremia (log-rank test for p < 0.001).