
Fig. 2.
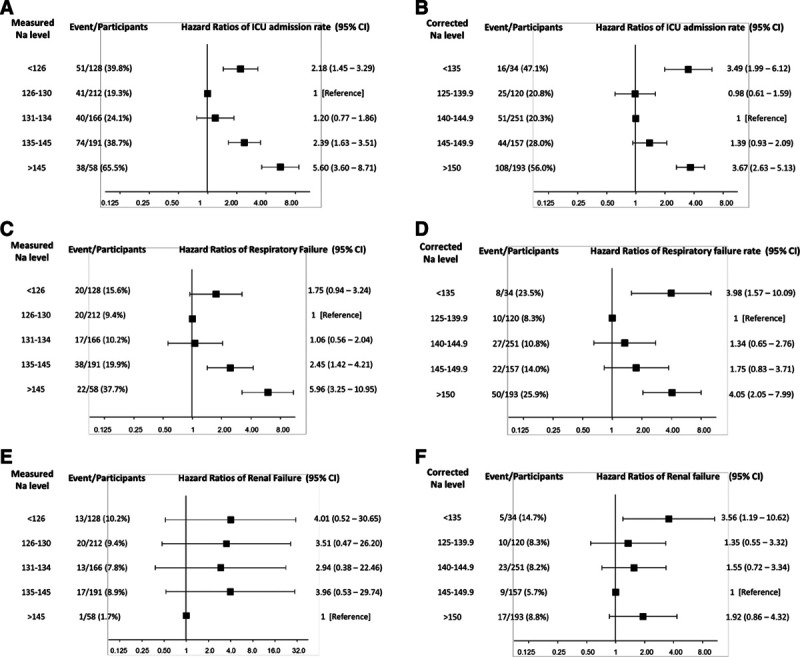
The hazard ratios (HRs) of secondary outcomes according to the measured and corrected sodium level. HRs for ICU admission rate according to the (A) measured and (B) corrected sodium level. HRs for respiratory failure rate according to the (C) measured and (D) corrected sodium level. HRs for renal failure rate according to the (E) measured and (F) corrected sodium level. The reference group was defined as the one with lowest events rate. The HRs with 95% confidence intervals are presented without adjustment.