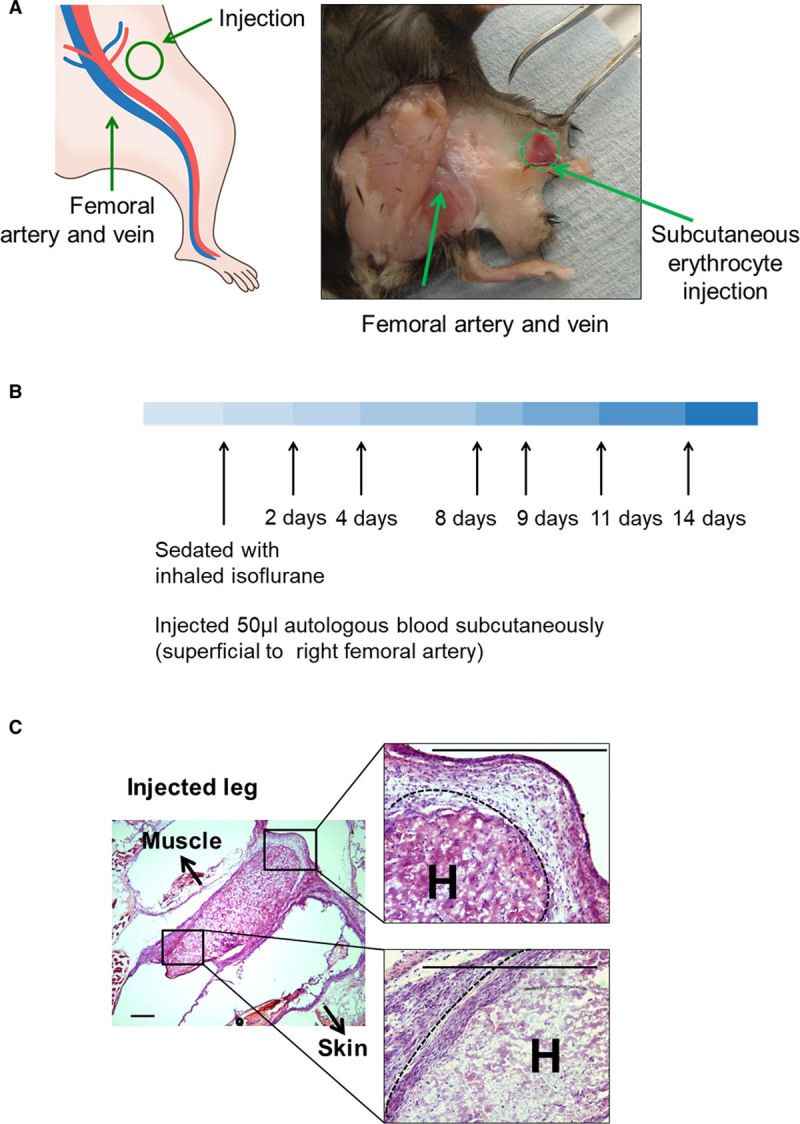
Figure 1.

Hematoma model. A, Diagram (left) and photograph of a representative dissection (right) of the site of subcutaneous injection of littermate autologous blood (50 μL) into perifemoral adipose tissue. B shows the time course of the model, and C shows histological micrographs taken immediately after injection, showing topography. Arrows point in the direction of skin and muscle. A dashed line marks the edge of the hematoma. Scale bars=100 μm. H indicates injected hematoma.
