
Figure 2.
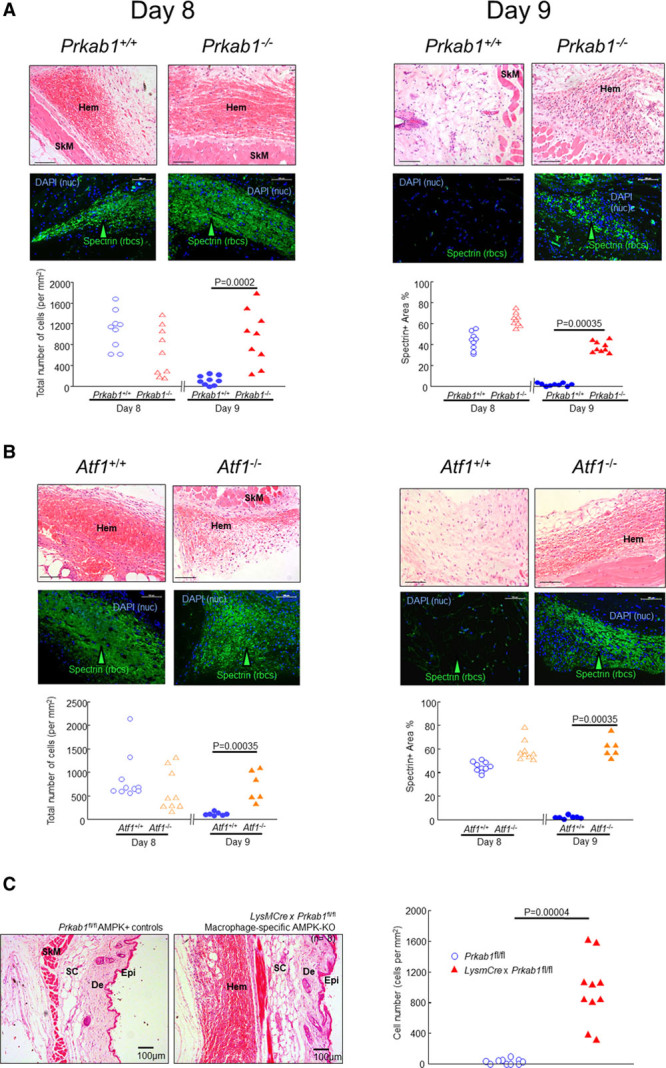
Loss of AMPK (AMP-activated protein kinase) or ATF1 (activating transcription factor-1) delays hematoma (Hem) clearance. The photomicrographs are representative of images of Hems obtained at day 8 or day 9 from mice with genetic deficiency of (A) AMPK (Prkab1−/−; n=9) or (B) ATF1 (Atf1−/−; n=6) or their littermate WT (wild type) controls (Prkab1+/+, Atf1+/+; n=9 and 9, respectively). The top rows show Hematoxylin and eosin (H&E) staining (scale bars=100 μm) and bottom rows show immunostaining with anti-spectrin antibodies (ie anti-erythrocyte) labeled with Alexa-488 (green) as indicated, arrowheads. Nuclei are stained blue with DAPI (4′,6-diamidino-2-phenylindole) to give total number of cells as indicated. Scale bars 100=μm. H&E (cell number) and immunostaining data are shown in the left- and right-hand graphs, respectively. The data points represent individual mice. Exact P values are as indicated for the indicated comparisons selected a priori (Mann-Whitney Utest). Lineage specificity of the deletion is shown in C. The Prkab1-KOMP-Ko-first-conditional-possible allele was first crossed with Frt-mice to remove the STOP (STOP codon), yielding Prkab1−fl/fl. These were then crossed again to remove the Frt. The progeny with the crossed with LysMCre and the F1 double-het progeny intercrossed, yielding LysMCre×Prkab1−fl/fl double homozygotes. These were then selected and bred as homozygotes. These Mac-AMPK-KO mice were then studied in the same Hem model as before. In the model, mice had Hems as expected at the earlier time point d8 (not shown, n=4). Left, Floxed controls without the Cre driver did not have Hems at the later time point (d9, n=9), indicating that these all cleared Hems as quickly as the other WT (wild type) controls. In contrast, mice lacking myeloid AMPK (LysMCre×Prkab1fl/fl) consistently had Hems still present at day 9 (10/10 mice, n=10; right). This indicates that the lack of Hem clearance in this model is specific to loss of AMPK in the macrophage lineage. Scale bars=100 µm. Graph, genotypes as indicated, each point represents 1 mouse. Exact P, Mann-Whitney U test. De indicates dermis; Epi, epidermis; KO, knockout; KOMP, Knockout Mouse Project; nuc, nuclei; rbcs, red blood cells; SC, subcutis; and SkM, skeletal muscle.