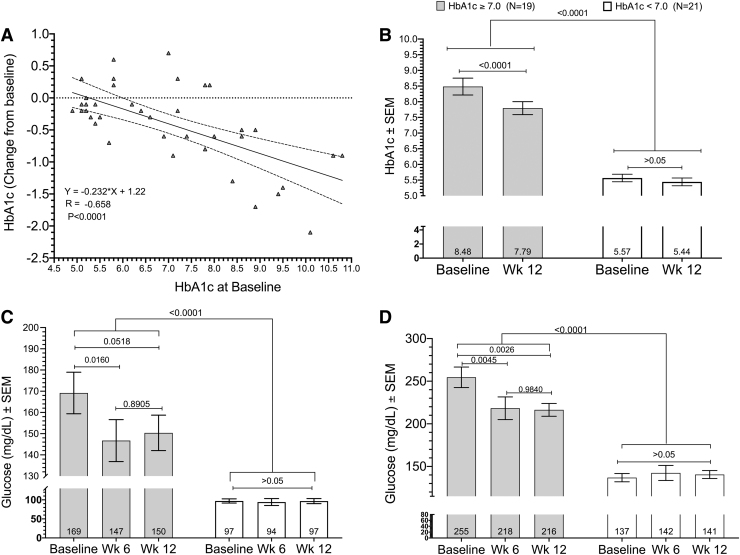
FIG. 2.
(A) Linear regression of absolute HbA1c changes over 12 weeks of consuming Nigella sativa/fenugreek supplemented chapatis 6 days per week as a function of baseline HbA1c. This association was linear with r = −0.658 (95% CI −0.804 to −0.436; P < .0001). Dotted lines represent 95% confidence belts. (B) Absolute HbA1c changes (±SEM) over 12 weeks for the HbA1c ≥7.0 and HbA1c <7.0 post hoc subgroups at baseline and 12 weeks. Mean absolute HbA1c decrease was −0.689 (−0.942 to −0.436; P < .001; N = 19) for HbA1c ≥7.0 subgroup versus no change (P > .05) for the HbA1c <7.0 subgroup. (C) FBG mg/dL (±SEM) over 12 weeks for the HbA1c ≥7.0 and HbA1c <7.0 post hoc subgroups, respectively, at baseline, 6 weeks, and 12 weeks. FBG fell −22.4 mg/dL (−3.51 to −41.3; P = .0160) and −18.8 mg/dL (−37.7 to 0.118; P = .0518) at 6 and 12 weeks, respectively, with no difference between changes at weeks 6 and 12 (P = .891). (D) PPBG mg/dL (±SEM) for the HbA1c ≥7.0 and HbA1c <7.0 post hoc subgroups at baseline, 6 weeks, and 12 weeks. PPBG fell −36.3 mg/dL (−62.8 to −9.82; P = .0045) and −38.2 mg/dL (−64.7 to −11.7; P = .0026), respectively, with no difference between changes at weeks 6 and 12 (P = .984). There were no differences from baseline in the HbA1c <7.0 subgroup for any of the glycemic variables at 6 or 12 weeks (B–D). Analyses were conducted using a two-way, fixed effects ANOVA model. ANOVA, analysis of variance; CI, confidence interval; FBG, fasting blood glucose; PPBG, postprandial blood glucose; SEM, standard error of mean.

