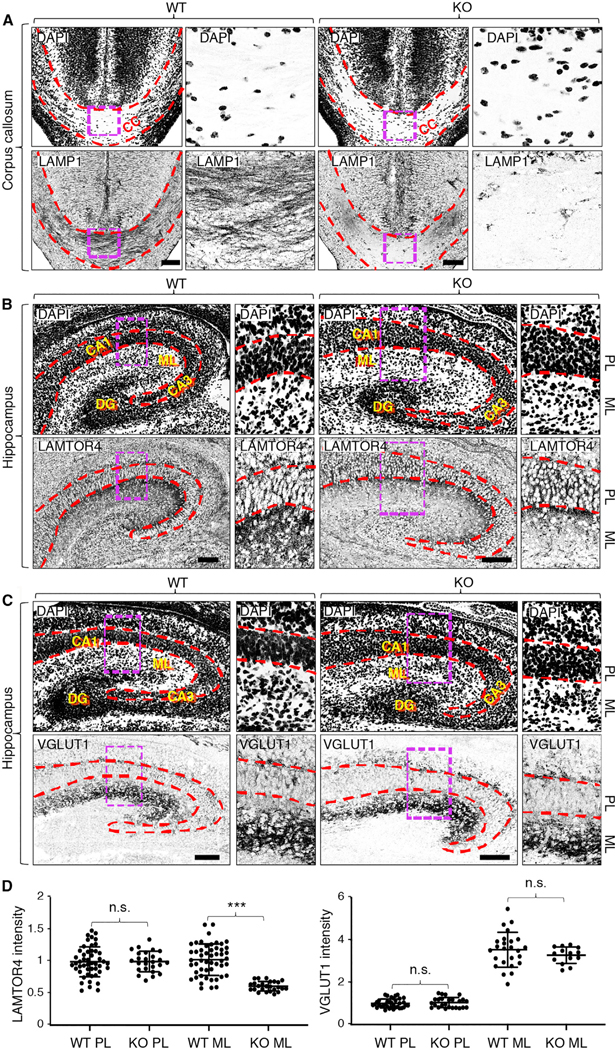
Figure 6. Decreased Staining for Lysosomal but Not SV Proteins in the Corpus Callosum and Molecular Layer of the Hippocampus in Myrlysin-KO Brains.

(A) Coronal sections of brains from WT and myrlysin-KO mouse E18 embryos were stained for endogenous LAMP1. Nuclei were stained with DAPI. Boxes are magnified on the corresponding right panels. The dashed red lines demarcate the boundaries of the corpus callosum (CC).
(B and C) Coronal sections of brains from WT and myrlysin-KO mouse E18 embryos mice stained for endogenous LAMTOR4 (B) or VGLUT1 (C). Nuclei were stained with DAPI. The dashed red lines demarcate the pyramidal layer (PL) of the hippocampus, including the cornu ammonis 1 and 3 (CA1 and CA3) regions. The molecular layer (ML) and dentate gyrus (DG) are also indicated. Images are shown in inverted grayscale. Scale bars: 100 μm.
(D) Quantitative analysis of LAMTOR4 and VGLUT1 intensity in the PL and ML of hippocampi from (B) and (C). The mean ± SD of fluorescence in different areas from two brains per condition is indicated. Statistical significance per Student’s t test: ***p < 0.005; n.s., not significant.
