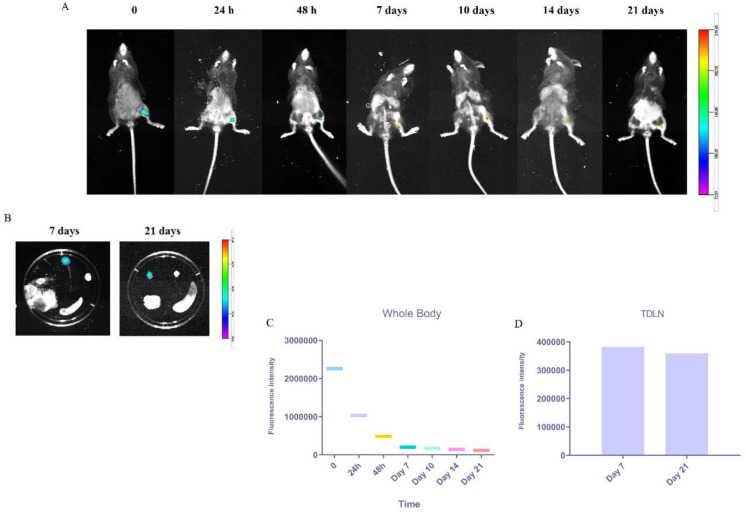
Figure 3.
In vivo lymphatic trafficking of s.c. administrated nanovaccine by animal imaging
(A) Representative whole-body images of DiD-labeled liposomal vaccine at different time points post-injection. (B) In vitro imaging of TDLNs 7- and 21-days post-injection. The quantitative fluorescence intensity of the DiD-labeled liposomal vaccine at the whole body (C) and of the signal emitted from TDLNs (D). The fluorescence intensity scale is displayed on the right side of the images

