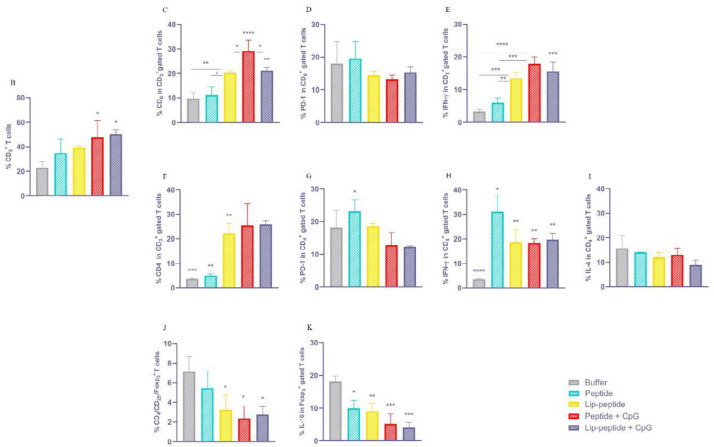
Figure 4.
Immunogenicity of liposomal nanovaccine
Immune responses determined with FACS Calibur Cell analyzer and presented in the spleen. (S4A) Representative dot plots demonstrating the gating strategies for flow cytometric analysis of CD3+ T cells and regulatory T cells. (B) Frequency of CD3+ cells indicating T cells, (C) Frequency of CD8 in CD3+ gated T cells, (D) Frequency of PD-1 in CD8+ T cells, (E) Frequency of IFN-γ in CD8+ T cells. (F) Frequency of CD4 in CD3+ gated T cells, (G) Frequency of PD-1 in CD4+ T cells, (H) Frequency of IFN-γ in CD4+ T cells, (I) Frequency of IL-4 in CD4+ T cells. (J) Frequency of CD4/CD25/ Foxp3 + T cells, (K) Frequency of IL-10 in Foxp3+ gated T cells. Results represented as Mean±SD; N=3. * P<0.05, **P<0.01, ***P<0.001 and ****P<0.0001 indicated as statistically significant differences

