Figure 9.
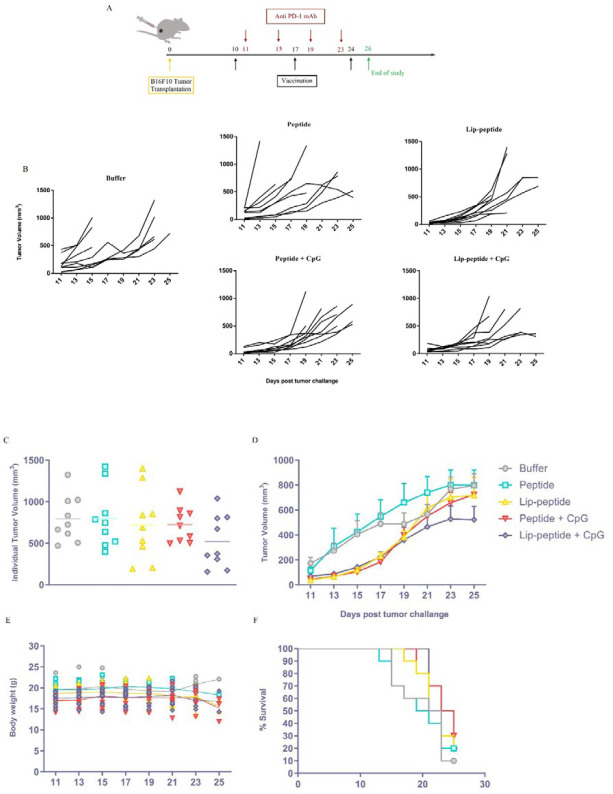
Enhanced antitumor effects in the B16F10 melanoma mouse model followed combination therapy. (A) Experimental schedules of C57BL/6 tumor-bearing mice combination therapy with vaccines and anti-PD-1 monoclonal antibody. Tumor growth measurements started at the same time of first priming, followed every two days and presented as tumor volume (mm3). Individual tumor growth curves of animals (B) and Individual tumor volume of B16F10 bearing mice in the last day of study (C). Overall tumor growth in different groups over time (D). Data represent Mean ± standard error of the mean (SEM); N=9. Monitoring the body weight of mice in each treatment groups (E). B16F10 challenged mice were followed for their survival rate up to 25 days and lack of survival was defined as tumor volume > 1000 mm3 or death (F). Differences in survival were determined by the Kaplan–Meier method and the P-value was calculated by the log-rank (Mantel–Cox) test

