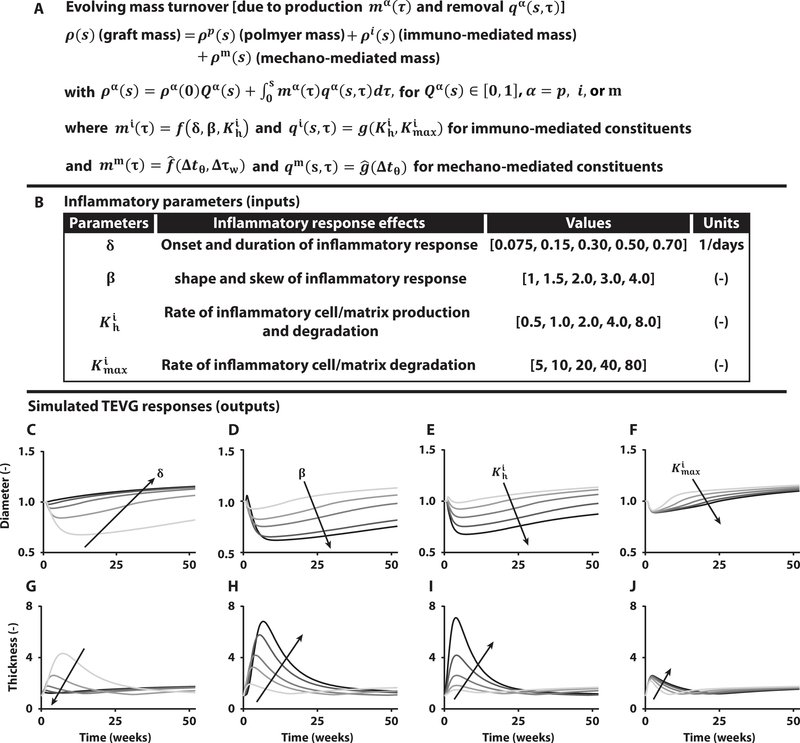
Fig. 3. Computational modeling predicts spontaneously reversible TEVG stenosis.
(A) Key equation within the overall computational model of TEVG development that accounts for changes in overall graft mass via changes in the rates of production mα and removal qα of different constituents α, each of which can depend on the inflammatory burden (superscript i), due to the foreign body response, and/or mechanobiological responses (superscript m), due to deviations Δ in circumferential wall stress tθ and luminal wall shear stress τw from homeostatic values. Here, f, and g, denote general functions, given in the Supplementary Materials. (B) Table of four key model parameters and possible ranges identified from previous experiments in immunocompetent and immunocompromised mice to bound the possible inflammation-driven process of neovessel formation. (C to J) Parametric studies for these four key parameters: δ modulates the onset and duration of the inflammatory response, β dictates the shape and skew of the inflammatory time course, controls the peak rates of inflammatory neotissue production and degradation, and scales inflammatory effects on neotissue degradation. Each plot focuses on the early evolution, up to 52 weeks after implantation, of normalized luminal diameter (top row) and wall thickness (bottom row) for variations in δ, β, , and , with arrows showing the direction of increasing values given in the table above.

