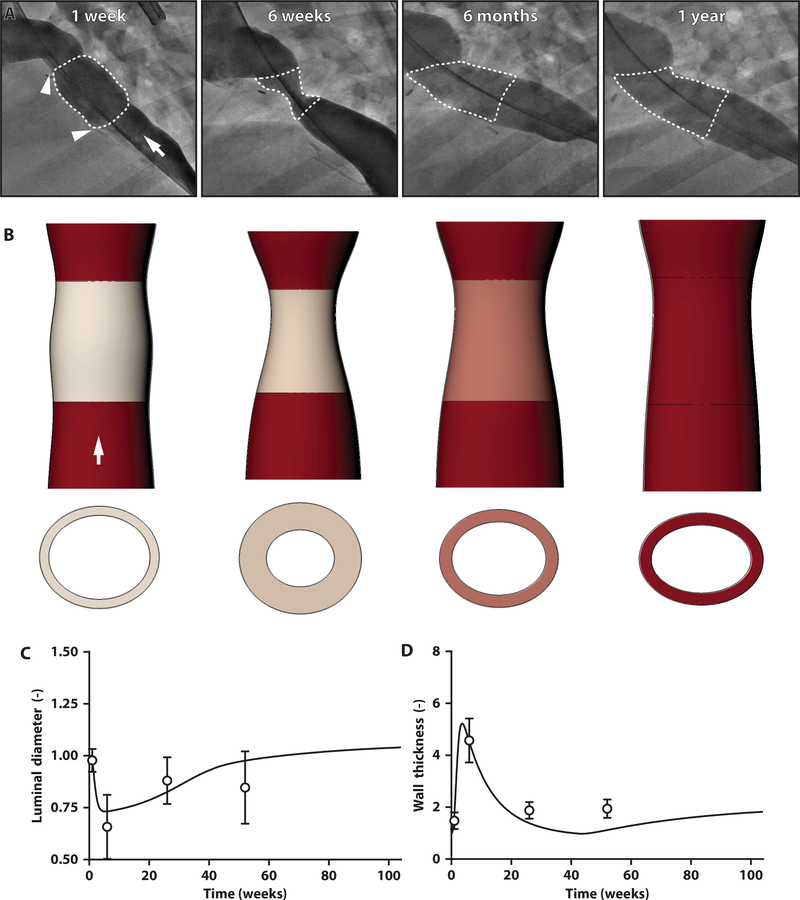
Fig. 4. TEVG stenosis spontaneously reverses in an ovine model.
(A) Serial angiographic images of a representative ovine TEVG 1 week, 6 weeks, 6 months, and 1 year after implantation. Anastomoses are identified with white arrowheads, and the TEVG is identified by a white dotted outline. White arrow indicates direction of blood flow. (B) Image reconstructions of serial IVUS and angiographic measurements of luminal area, wall thickness, and length of the TEVG, confirming the development of stenosis at 6 weeks but spontaneous resolution by 6 months after implantation. White arrow indicates direction of blood flow. When based on lamb data, the model simulations (solid lines) for the midgraft (C) luminal diameter and (D) wall thickness fit well the hydraulic diameters calculated from the IVUS measurements (symbols) over the 1-year study. Ovine IVUS measurements are represented as means ± SD (n = 22 at 1 week, n = 22 at 6 weeks, n = 20 at 6 months, n = 15 at 1 year).

