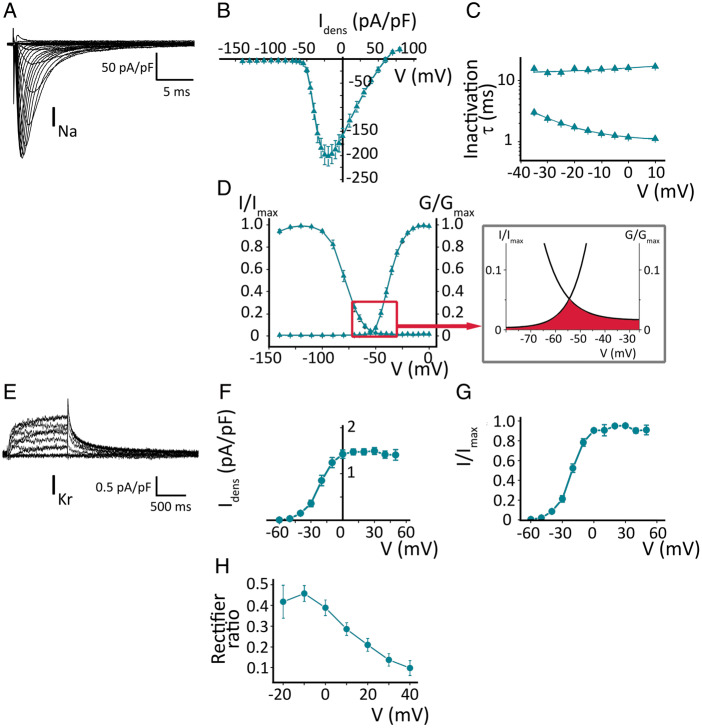
Figure 2.
Ion currents in Pluricyte® CMs. (A) Voltage-dependent INa activation; representative family of traces. (B) INa-density I–V relationship (n = 19). (C) Kinetics of voltage-dependent steady-state inactivation, obtained by a double exponential fit. (D) Steady-state activation and inactivation, with conductance and current normalized to their maximum values. Inset shows the ‘window-current’, as the area under the crossing between the steady-state activation and inactivation curves. (E) Voltage-dependent IKr activation. (F) IKr-density I–V relationship (n = 18). (G) Steady-state activation of IKr; current normalized to maximum value. (H) Rectifier ratio, correlating the conductance of the depolarizing step with the IKr-tail conductance.

