Figure 5.
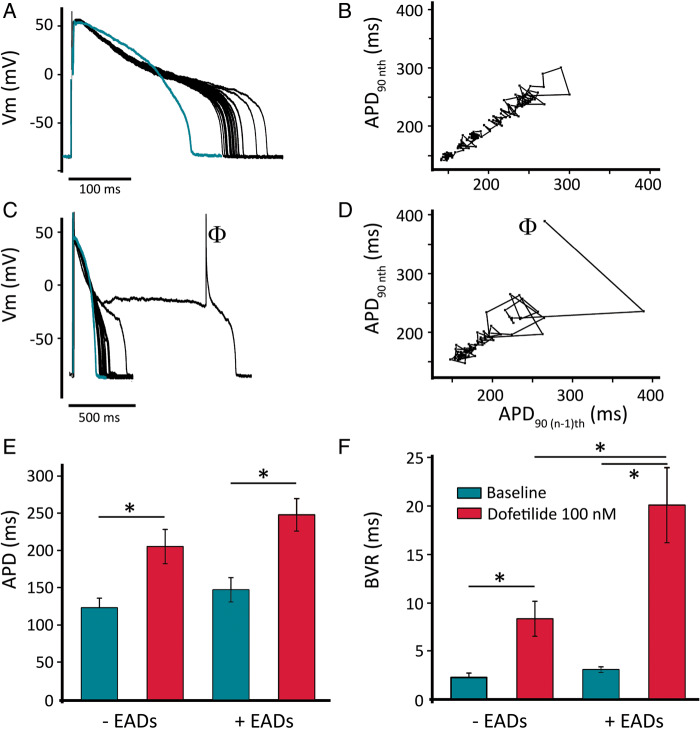
Increased BVR precedes EAD generation. (A) Representative example of repolarization variability by IKr block without EAD generation, compared to baseline (green trace). (B) Poincaré plot of APD90 of the same cell as in panel (A). (C) Representative example of repolarization variability by dofetilide, compared to baseline (green trace; note the different time axis), in a cell that eventually generated an EAD (indicated by the symbol Φ). (D) Poincaré plot of APD90 of the same cell as in panel (C) before the very first EAD recorded. (E) Average APD in cells that developed EADs (n = 10) or did not (n = 10). (F) Average BVR (prior to first EAD, if any) in cells that developed EADs (n = 10) or did not (n = 10).

