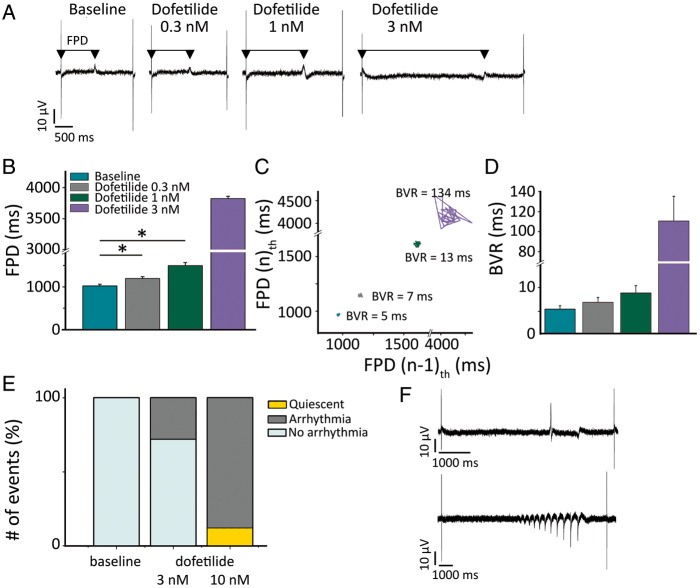
Figure 6.
Repolarization instability and arrhythmia in MEAs upon IKr block. (A) Representative field potentials, at escalating dofetilide concentrations (0.3, 1, 3 nmol/L). The arrows indicate the FPD. (B) Average values of FPD for each dofetilide concentration (n = 4 per condition). (C) Poincaré plot depicting the FPD BVR at escalating dofetilide concentration for a selected electrode. (D) Average values of FPD BVR in MEAs (n = 4). (E) Arrhythmia inducibility as percentage of total events, at baseline and during dofetilide 3 and 10 nmol/L (n = 8 per condition). (F) Representative examples of two types of arrhythmia [single abnormal impulse (above) and burst (below)] triggered by dofetilide.

