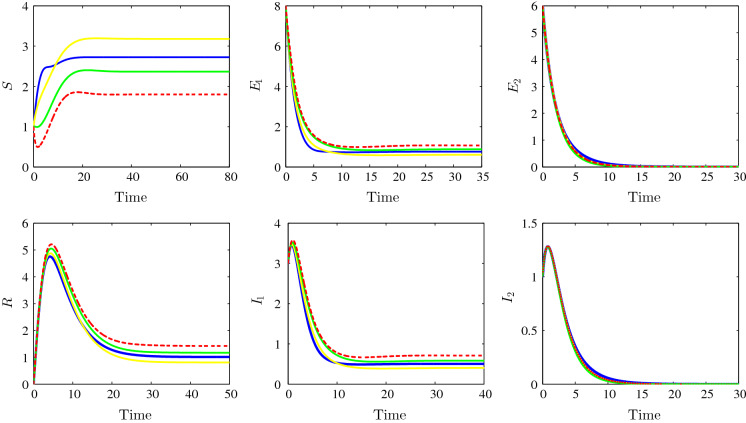
Fig. 3.
Time evolution of susceptible (top left), the strain 1 latent individuals (top middle), the strain 2 latent individuals (top right), the recovered (bottom left), the strain 1 infectious individuals (bottom middle) and the strain 2 infectious individuals (bottom right) illustrating the stability of the strain 1 endemic equilibrium . The bilinear incidence functions (dotted red), Beddington–DeAngelis incidence functions (yellow), Crowley–Martin incidence functions (green) and the non-monotone incidence functions (blue). (Color figure online)

