
Figure 3.
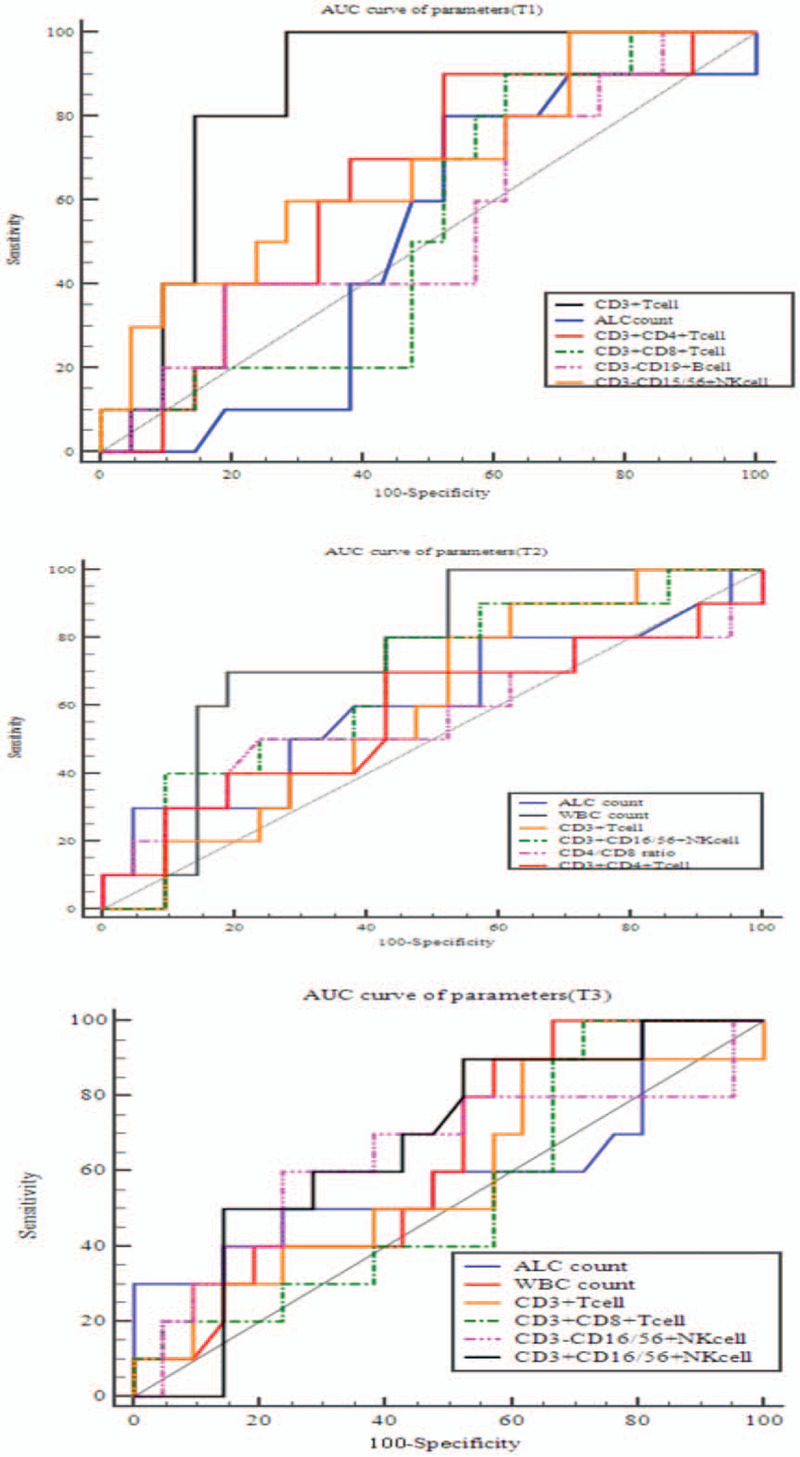
AUC curve of blood subsets for survival at 3 time points (T1, T2, T3). RT = radiotherapy; T1 = pre-RT; T2 = the day when the full course of radiotherapy was completed; T3 = 3 months after the final fraction of RT.
Official websites use .gov
A
.gov website belongs to an official
government organization in the United States.
Secure .gov websites use HTTPS
A lock (
) or https:// means you've safely
connected to the .gov website. Share sensitive
information only on official, secure websites.
AUC curve of blood subsets for survival at 3 time points (T1, T2, T3). RT = radiotherapy; T1 = pre-RT; T2 = the day when the full course of radiotherapy was completed; T3 = 3 months after the final fraction of RT.