
Figure 4.
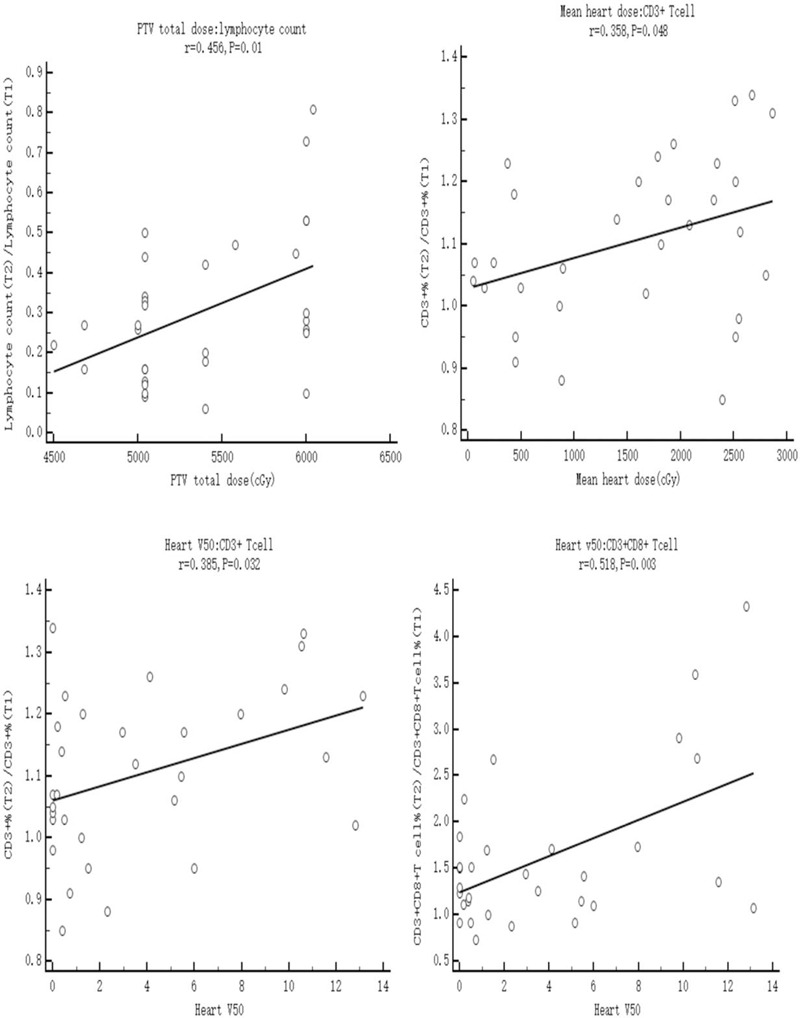
Person analysis of dose parameters and blood subsets at the end of RT (T2), assuming blood values at pre-radiotherapy (T1) of 1. A. Presents the relationship between total ALC count and PTV total dose (P = .01). B. Presents the relationship between mean heart dose and CD3+T cells (P = .048). C. Presents the relationship between heart V50 and CD3+ cells (P = 0.032). D. Presents the relationship between heart V50 and CD3+CD8+T cells (P = .003). ALC = lymphocyte count, RT = radiotherapy; T1 = pre-RT; T2 = the day when the full course of radiotherapy was completed; T3 = 3 months after the final fraction of RT.