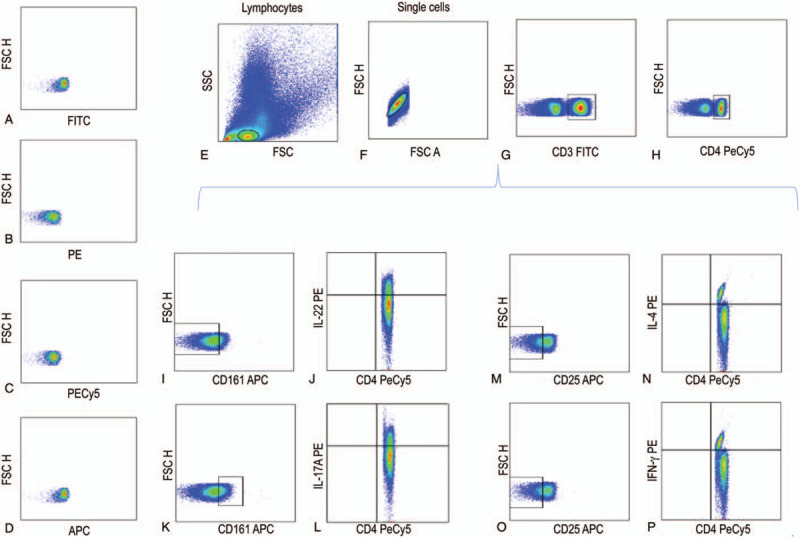
Figure 1.

Representative gating strategy of each cell population of CD4 effector T cells. (A) IgG1 FITC isotype control, (B) IgG1 PE isotype control, (C) IgG1 PECy5 isotype control, (D) IgG1 APC isotype control, (E) Lymphocytes, (F) Single cells, (G) CD3+ cells, H) CD3+/CD4+ cells, (I) CD3+/CD4+/CD161- cells, (J) CD3+/CD4+/CD161-/IL-22+ cells, K) CD3+/CD4+/CD161+ cells, (L) CD3+/CD4+/CD161+/IL-17+ cells, (M) CD3+/CD4+/CD25- cells, (N) CD3+/CD4+/CD25-/IL-4+ cells, (O) CD3+/CD4+/CD25- cells, and (P) CD3+/CD4+/CD25-/IFN-γ+ cells.
