
Figure 5.
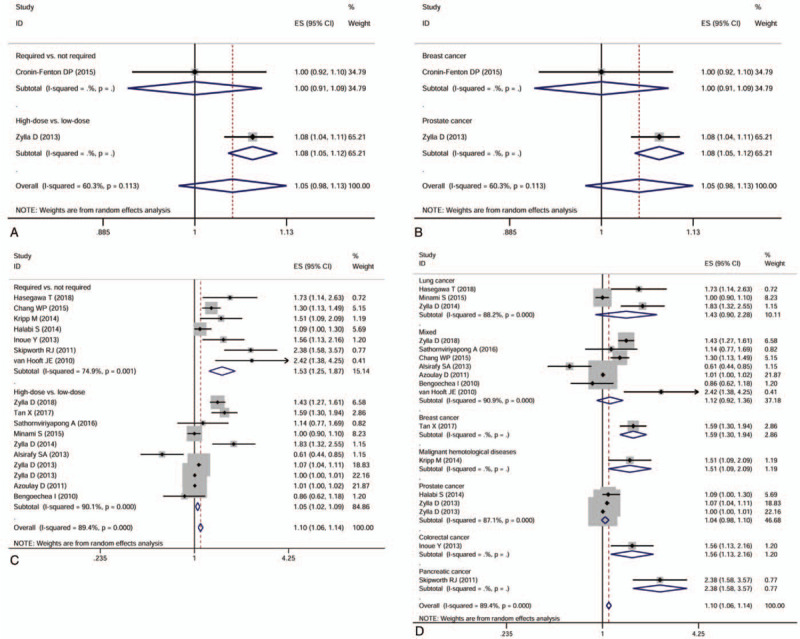
Forest plots of subgroup analyses evaluating the effect of opioids use on cancer progression-free survival based on therapeutic dose (A) and cancer types (B), and the effect of opioids use on overall survival based on therapeutic dose (C) and cancer types (D).