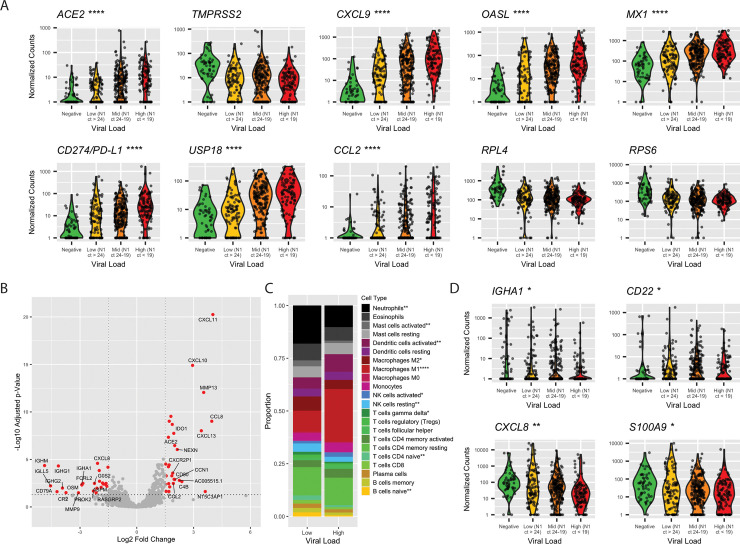
Fig 2. Differences in gene expression by SARS-CoV-2 viral load.
(A) Violin plots of select genes by viral load. Statistical significance between low and high viral load calculated by Mann Whitney U test, *p < 0.05, **p < 0.01, ***p < 0.001, ****p < 0.0001. (B) Volcano plot of 15 most up-regulated and 15 most down-regulated genes in SARS-CoV-2 high viral load samples relative to low viral load by log2 fold change. Red color indicates genes with log2 fold change > |1.5| and adjusted p < 0.05. (C) Proportion of cell types as a total of all immune cells, by CIBERSORTx. Significant differences in proportion of each cell type determined by t test, *p < 0.05, **p < 0.01, ***p < 0.001, ****p < 0.0001. (D) Violin plots of B cell transcripts and neutrophil chemokine transcripts by viral load. Statistical significance between low and high viral load calculated by Mann Whitney U test, *p < 0.05, **p < 0.01, ***p < 0.001, ****p < 0.0001. Raw data available in the GEO Repository, accession GSE152075. Ct, cycle threshold; GEO, Gene Expression Omnibus; N1, SARS-CoV-2 nucleocapsid gene region 1; NK, natural killer; SARS-CoV-2, severe acute respiratory syndrome coronavirus 2; Treg, regulatory T cell.

