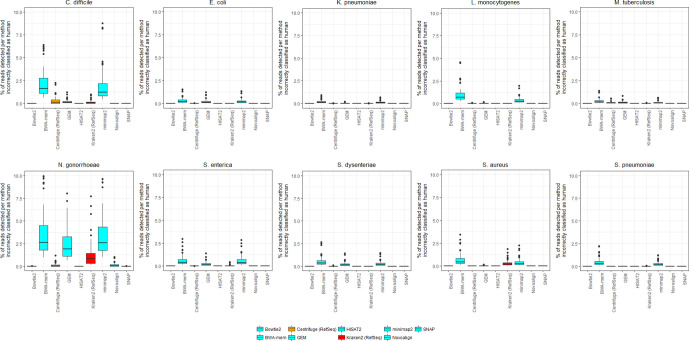
Fig. 2.
The percentage of reads incorrectly classified as human by nine different methods of human read detection within a range of microbial read datasets, partitioned by species. Data for this figure are available in Table S2 and constitute simulated reads at 10-fold coverage from each of 10 species supplemented with 0–10% human contamination, using both 150 and 300 bp reads. Data from three methods (the aligner SMALT and the classifiers Kraken2 and Centrifuge, each using a human-only database) are not shown. This is because these methods have a very high false positive rate across all species (Fig. 1). Data from viral datasets are not shown because in our simulations no viral read was incorrectly classified as human, by any method (Table S3).

