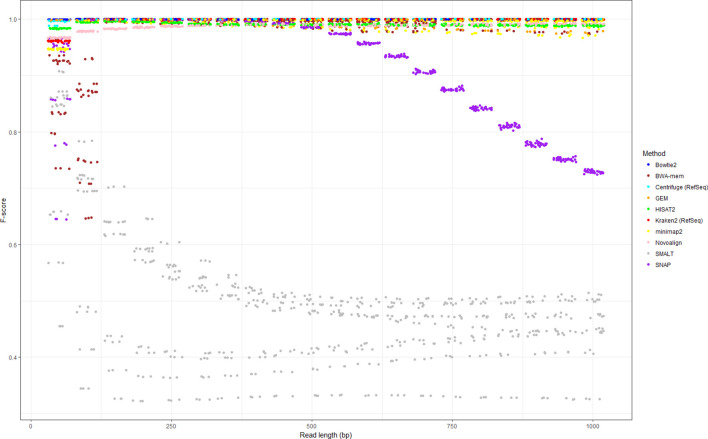
Fig. 3.
Performance of 10 different methods of identifying human reads within a range of microbial read datasets (comprising 10 bacterial species sequenced at an average base-level coverage of 10-fold, each with 10 % simulated human contamination). All reads were simulated from, and where relevant aligned to, human genome version GRCh38.p12. Each point represents a simulation replicate, coloured according to method. Points are jittered to allow over-plotting. There is considerable overlap between points as many methods perform equivalently highly when using long reads. Data for this figure are available in Table S3.

