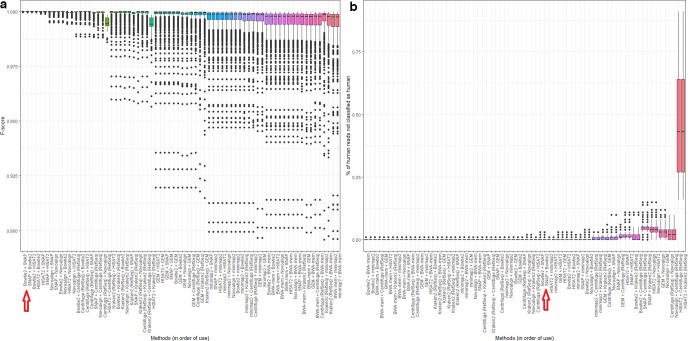
Fig. 5.
Performance of all two-stage combinations of nine independent methods of identifying human reads within a range of microbial read datasets (72 pairwise combinations; the data comprise 10 bacterial species, each with between 1 and 10% simulated human contamination, using both 150 and 300 bp reads). All reads were simulated from, and where relevant aligned to, human genome version GRCh38.p12. The subfigures show (a) the F-score, and (b) the percentage of human reads not classified as human. Bars in both subfigures are ordered from left to right by increasing variance, and in alphabetical order for methods with equal variance. Bowtie2 + SNAP is indicated on the axis. Data for this figure are available in Table S7.

