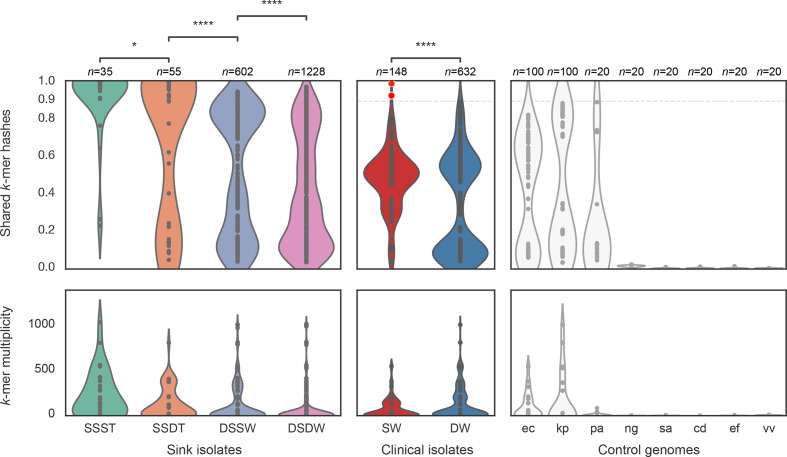
Fig. 5.
Metagenomic containment of sink (left) and patient (centre) cultured lineage-representative genome assemblies, and control genomes (right). Shared k-mer hashes and median k-mer multiplicity values are as reported by MASH Screen. SSST=same sink and same timepoint; SSDT=same sink at different timepoints (shared hashes Mann–Whitney P=0.013 vs. SSST); DSSW=different sinks of the same ward (P<0.0001 vs. SSDT); DSDW=sinks on a different ward (P<0.0001 vs. DSSW). SW=lineage-representative assemblies of clinical isolates in the same ward; DW=lineage-representative assemblies of clinical isolates from a different ward (P<0.0001 vs. SW). Control genomes comprised E. coli , K. pneumoniae, P. aeruginosa, N. gonorrhoeae , S. aureus , C. difficile , E. faecalis and V. vulnificus , shown abbreviated with binomial initials. A case of within-ward sink-patient overlap is highlighted with red markers, corresponding to high strain containment in the metagenomes of sink A25 timepoints 1 and 4.

