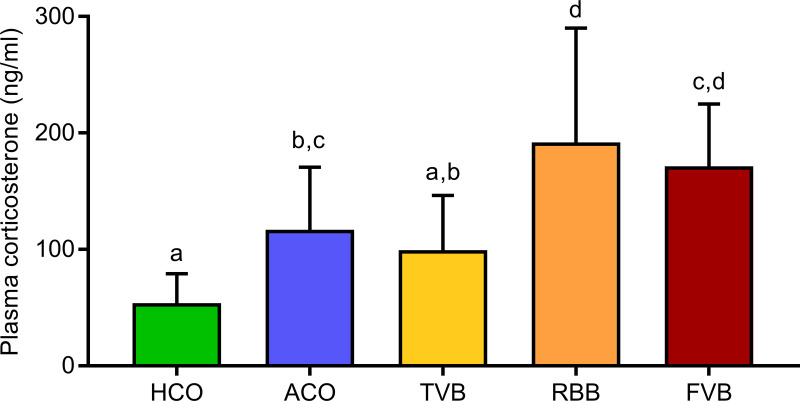
Fig 2. Plasma corticosterone levels 15 minutes after blood sampling or control treatment.
Statistics: ANOVA; post hoc testing: Bonferroni, n = 12 per treatment group. Significant differences between groups are indicated by different letters. Data are presented as means and SEM. The underlying numerical data of the figure are available in the supporting information (S1 Data). HCO, handling control; ACO, anaesthesia control; TVB, tail vessel bleeding; RBB, retrobulbar bleeding; FVB, facial vein bleeding.

