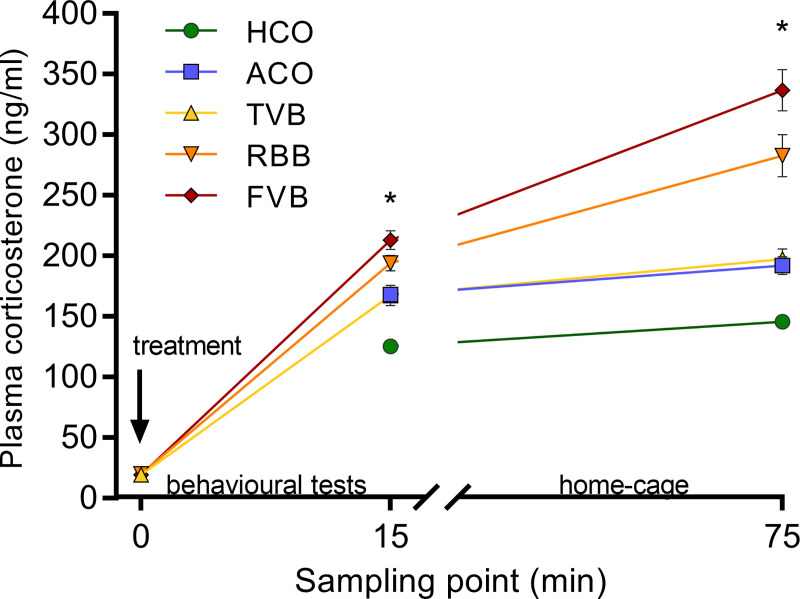
Fig 5. Baseline (0 min), acute (15 min) and recovery (75 min) plasma corticosterone levels after the respective treatment.
Baseline values did not differ significantly between treatment groups. A significant difference (* p < 0.05) was detected between the treatment groups for the acute and recovery corticosterone levels. Acute levels were significantly lower in HCO animals compared to all other groups (ACO: p = 0.001, TVB: p = 0.001, RBB: p < 0.001, FVB: p < 0.001). In addition, animals that underwent FVB differed significantly from the ACO (p = 0.002) and TVB groups (p = 0.003). Recovery values were significantly lower in the HCO group compared to all other groups (p = 0.002, TVB: p = 0.002, RBB: p < 0.001, FVB: p < 0.001). Moreover, ACO and TVB groups differed significantly from RBB or FVB groups (Games-Howell post hoc: RBB vs ACO: p = 0.007, RBB vs TVB: p = 0.010, FVB vs ACO: p < 0.001, FVB vs TVB: p = 0.001). Statistics: ANOVA with Welch’s test in case of unequal variances; post hoc testing: Bonferroni or Games-Howell in case of unequal variances; at sampling point ‘0’ n (TVB) = 9, n (RBB) = 10, n (FVB) = 10; at sampling point ‘15’ n (HCO) = 10, n (ACO) = 10, n (TVB) = 9, n (RBB) = 12, n (FVB) = 11; at sampling point ‘75’ n (HCO) = 10, n (ACO) = 10, n (TVB) = 9, n (RBB) = 11, n (FVB) = 10. Data are presented as means ± SEM. The underlying numerical data of the figure are available in the supporting information (S1 Data). HCO, handling control; ACO, anaesthesia control; TVB, tail vessel bleeding; RBB, retrobulbar bleeding; FVB, facial vein bleeding.

