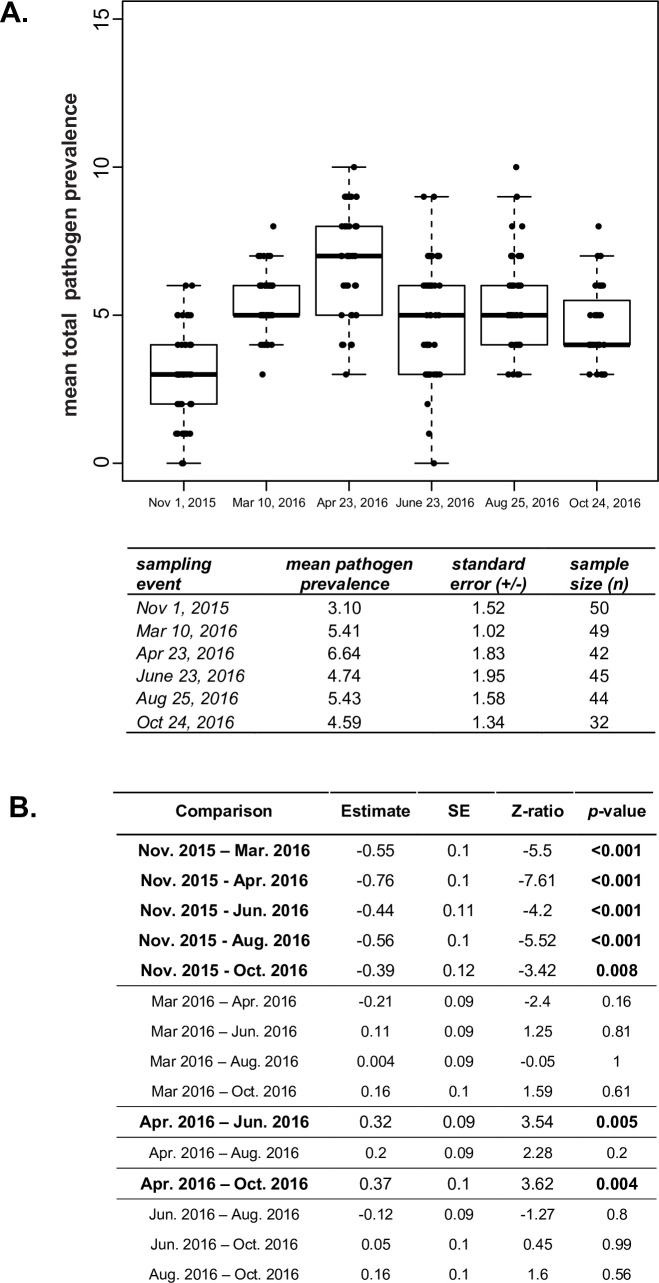
Fig 4. Mean total pathogen prevalence is highest in the spring.
A. The observed mean pathogen prevalence was lowest at the onset of the study (November 2015) and highest just after almond pollination (April 2016). Honey bee samples were obtained from monitored colonies (n≤50) on six sampling dates over the course of one year (November 2015 to October 2016) and were tested for the presence of 13 pathogens. The total observed pathogen prevalence was determined by summing the number of different pathogens detected in each sample and the mean number of pathogens per sampling event and associated standard error were calculated. B. The estimated change in mean total pathogen prevalence in honey bee colonies between sampling dates was compared using a generalized linear mixed effect model (GLMM) with Tukey’s adjusted, pairwise, comparison. The estimated log fold-change of the total mean pathogen prevalence between sampling events (estimate) was greater in all five time points following the onset of the study in November 2015 and peaked in April 2016 after the late February, early March almond bloom. Significant comparisons (p-value < 0.05) are bolded.

