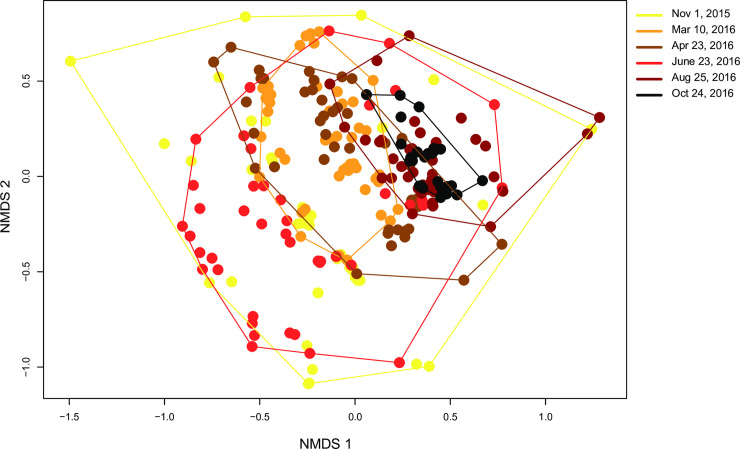
Fig 10. Relative virus composition of honey bee colonies varies by sample date.
The virus community composition varied by sampling date (PERMANOVA, F1,255 = 26.90, p-value = 0.001). The community composition for each sample (i.e., the log natural transformed abundance of BQCV, CBPV, DWV, SBV, LSV1, LSV2, LSV3, LSV4, and IAPV, as assessed by qPCR) was compared in relation to sample date (i.e., November 2015 (yellow), March 2016 (orange), April 2016 (brown), June 2016 (red), August 2016 (maroon), October 2016 (black)). The position of each point indicates the virus composition of each sample relative to all other samples (i.e., samples with more similar virus composition are closer), calculated using a Bray-Curtis dissimilarity index and plotted on a non-metric multidimensional scaling (NMDS) plot. A homogeneity of community variance test (BETADISPER) was conducted and the mean dispersion (distance to centroid) is significant with respect to the day of the study (F5,250 = 8.154, p-value < 0.0001). Pathogen communities were more variable in March 2016 (mean = 4.90, CI = 1.06 to 8.76), April 2016 (mean = 5.33, CI = 1.36 to 9.31), and June 2016 (mean = 7.43, CI = 3.51 to 11.35) compared to the final sampling time point in October 2016.

