Figure 3.

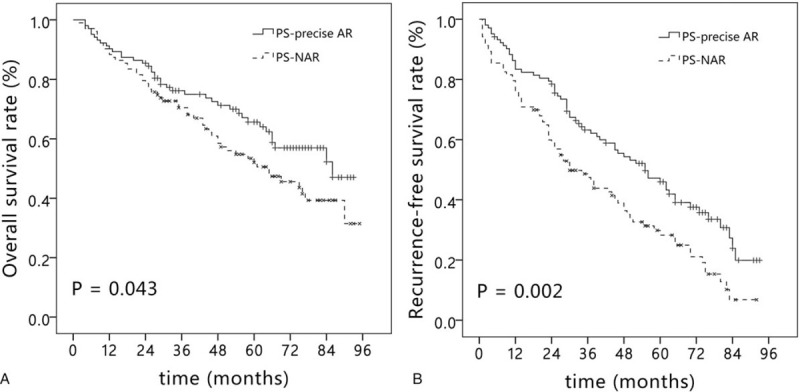
Kaplan–Meier curve of overall survival (A) and recurrence-free survival (B) in the precise AR group and NAR group after propensity score matching. AR = anatomical resection, NAR = non-anatomical resection.

Kaplan–Meier curve of overall survival (A) and recurrence-free survival (B) in the precise AR group and NAR group after propensity score matching. AR = anatomical resection, NAR = non-anatomical resection.