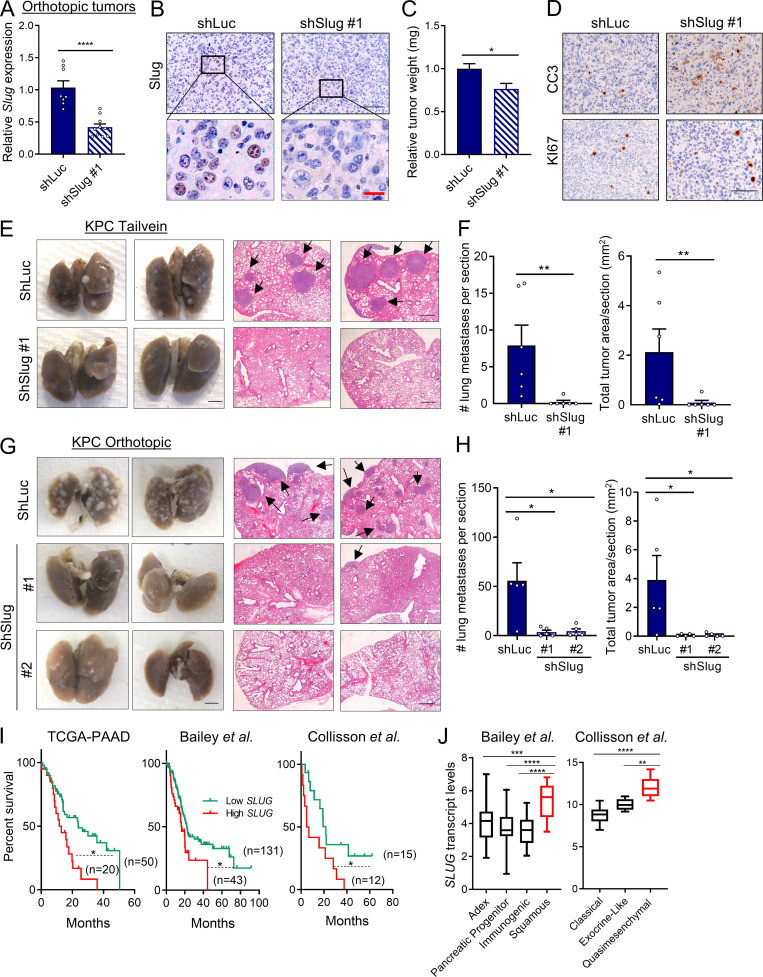
Figure 5.
Slug regulates metastasis in PDAC. (A) Relative Slug mRNA expression evaluated by qPCR in EKPC shLuc or EKPC shSlug#1 orthotopic tumors. Results are expressed relative to shLuc. Data are expressed as mean ± SEM; n = 8 shLuc tumors; n = 10 shSlug#1 tumors. (B) Immunohistochemical staining of Slug protein in EKPC shLuc or EKPC-shSlug#1 orthotopic tumors. The inset boxes indicate the areas further magnified below. Black scale bar, 100 µm; red scale bar, 20 µm. (C) Relative tumor weight of EKPC shLuc or EKPC shSlug#1 orthotopic tumors. Data are expressed as mean ± SEM; n = 8 shLuc tumors; n = 10 shSlug#1 tumors. (D) Immunohistochemical staining of cleaved caspase 3 (CC3) and KI67 in EKPC shLuc or EKPC shSlug#1 orthotopic tumors. Images are representative of n = 3 tumors. Scale bar, 100 µm. (E) Lung colonization capacity of KPC shLuc and KPC shSlug#1 cells injected into the tail vein of syngeneic mice. Representative images of whole lungs and H&E-stained lung sections are shown. The arrows indicate lung metastatic foci. Images are representative of n = 6 mice per group. Scale bars: left panel, 2.5 mm; right panel, 500 µm. (F) Quantification of lung colonies (number and area per section) after tail vein injection as described in E. Data are presented as mean ± SEM; n = 6 mice per group. (G) Representative images of macroscopic and H&E-stained lungs of mice bearing KPC shLuc, KPC shSlug#1, or KPC shSlug#2 orthotopic tumors. The arrows indicate lung metastatic foci. Scale bars: left panel, 2.5 mm; right panel, 500 µm. (H) Quantification of lung metastatic colonies (number and area per section) originated from KPC shLuc, KPC shSlug#1, or KPC shSlug#2 orthotopic tumors as described in G. Data are presented as the mean ± SEM for n = 5 mice per group. (I) Kaplan–Meier survival analysis of the indicated datasets comparing low and high SLUG expression in PDAC patients. (J) Box plots representing SLUG transcript levels across different PDAC subtypes from the indicated public datasets. Data are presented as box and whiskers plots. Vertical lines extend to the minimum and maximum values. ADEX, aberrantly differentiated endocrine exocrine. Statistical significance was determined using unpaired two-tailed Student’s t test in A and C; Mann–Whitney nonparametric U test in F and H; log-rank (Mantel–Cox) test in I; and one-way ANOVA followed by Tukey test for multiple comparisons in J. Data were pooled from two cohorts (A–D, G, and H) and are representative of two independent experiments (E and F). *, P < 0.05; **, P < 0.01; ***, P < 0.001; ****, P < 0.0001.

