Figure S1.
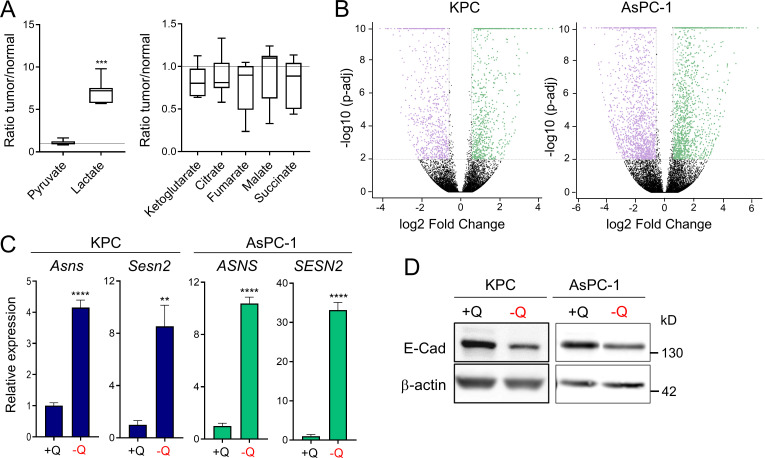
Glutamine deprivation induces metabolic stress and EMT in PDAC cells. (A) Quantification of metabolites in orthotopic KPC tumors relative to murine normal pancreas tissue. Data are presented as box and whiskers plots. Vertical lines extend to the minimum and maximum values. n = 6. (B) Volcano plots showing differentially expressed genes identified by RNA-seq in KPC or AsPC-1 cells grown in glutamine-replete versus glutamine-free medium for 24 h (fold-change ≥2 and less than or equal to −2; P < 0.05). n = 5 samples per group. (C) Relative gene expression of metabolic stress markers Asns and Sesn2 from RNA-seq analysis of KPC or AsPC-1 cells grown in glutamine-replete versus glutamine-free medium for 24 h. Results are expressed relative to the control cells (+Q). Data are expressed as mean ± SEM; n = 5 replicates. (D) Immunoblots assessing E-cadherin (E-Cad) protein expression in KPC or AsPC-1 cells in glutamine-replete or glutamine-free medium for 24 h. β-actin was used as a loading control. Statistical significance was determined using unpaired two-tailed Student’s t test. Data were generated from one experiment with n = 6 tumors (A) or n = 5 samples (C) or are representative of three independent experiments (D). **, P < 0.01; ***, P < 0.001; ****, P < 0.0001.

